


Physics around us: from a first experiment to your own lab Lesson 8 of 8
Checkpoint: a pendulum investigation
Assemble your first complete investigation report and check that every conclusion follows from the record.
Where we are on the map
The map shows the reasoning order. Its numbers are worked examples unless the lesson explicitly identifies your own measurement. You are in the first of eleven blocks.
A question from daily life
You now have the pieces: a question, a fair comparison plan, length, time for ten swings, period, a table, and a graph. Link them in a report another person could repeat.
Words and meanings
A reproducible report gives enough exact actions and data for someone else to repeat the work. A limit of a conclusion states what was not tested. No new formula is needed. If you lack a weight, ruler, or stopwatch, you can analyse the supplied numbers while clearly labelling them worked data. That is data analysis, not your own experiment.
Predict before checking
Before looking at the example, predict which of the two lengths will have the longer period. What result would go against your prediction?
Do it and record it
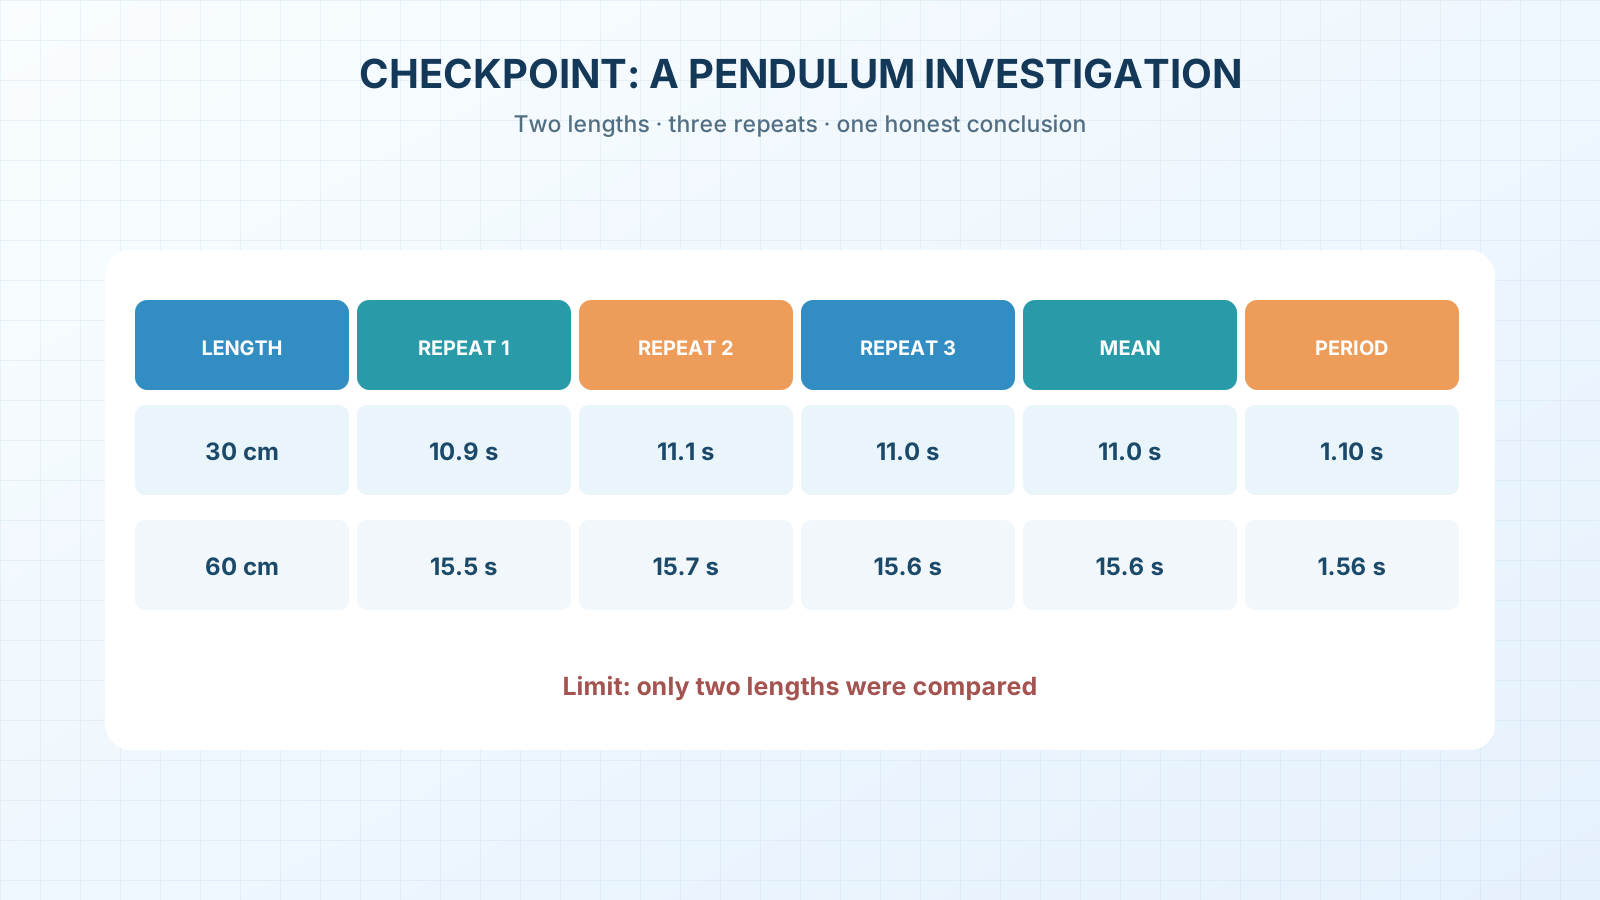
Where safe, measure 30 and 60 cm from the hanging point to the centre of the same lightweight weight. At each length, time ten complete swings three times without pushing. Keep other conditions as similar as you can. Record surprising numbers too. If you cannot do the experiment, use the worked data below and say so.
| Length L, cm | Repeat 1, s | Repeat 2, s | Repeat 3, s | Mean t₁₀, s | T, s |
|---|---|---|---|---|---|
| 30 | 10.9 | 11.1 | 11.0 | 11.0 | 1.10 |
| 60 | 15.5 | 15.7 | 15.6 | 15.6 | 1.56 |
A worked example
Worked data: 30 cm → 10.9, 11.1, 11.0 s; 60 cm → 15.5, 15.7, 15.6 s. Mean t₁₀ values: 11.0 and 15.6 s. Mean T values: 1.10 and 1.56 s. Difference in T: 0.46 s. Plot only the two measured pairs. This calculation example is not evidence that your own results match it.
A common mistake
‘I proved a law for all pendulums’ goes beyond the experiment. We compared two lengths, one weight, and a small starting tilt. We did not test a different weight or large tilts, or explain the motion using forces.
A new situation
Another team gets 11.2, 11.0, and 11.1 s at 30 cm. Their mean t₁₀ is 11.1 s and period 1.11 s. If yours is 1.10 s, must someone be wrong? Name two possible sources of a small difference and a way to check.
Notebook entry and self-check
Submit seven parts: question, prediction, setup sketch, original numbers with units and source, calculation, graph, and a conclusion with a limit. Can another person tell where to start counting and where the length measurement ends?
If you have found a mistake or a typo in this article, tell us about it
Comments (0)
Log in to leave a comment →
No comments yet. Be the first.