The forty-sixth lesson of the Python course and the end of the module on models. The same line promises an index of 146,206 for the year 2100 and minus a thousand for 1800 — and marks neither answer as doubtful. The border has to be written by hand: what it learned on, where it was checked, past which year it no longer holds.
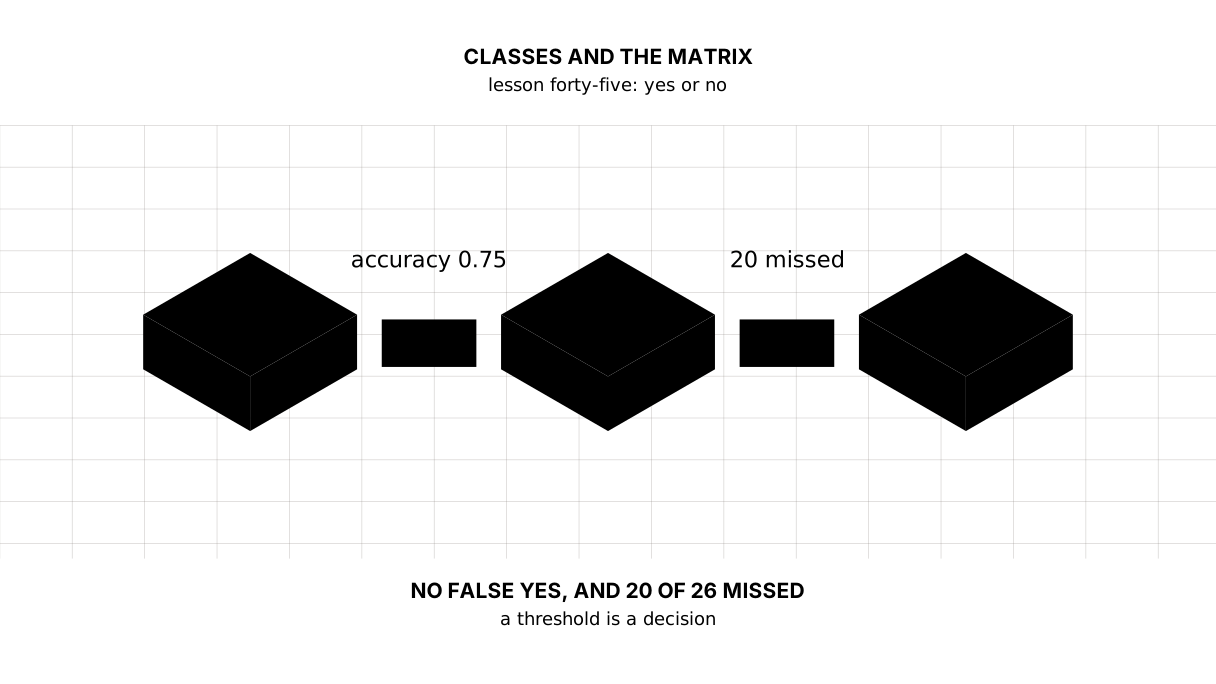
The forty-fifth lesson of the Python course. The model answers yes or no: will next year's inflation be above ten per cent. Accuracy of 0.75 against 0.675 for a model that always says no — and the confusion matrix shows that twenty of the twenty-six high years were missed along the way.
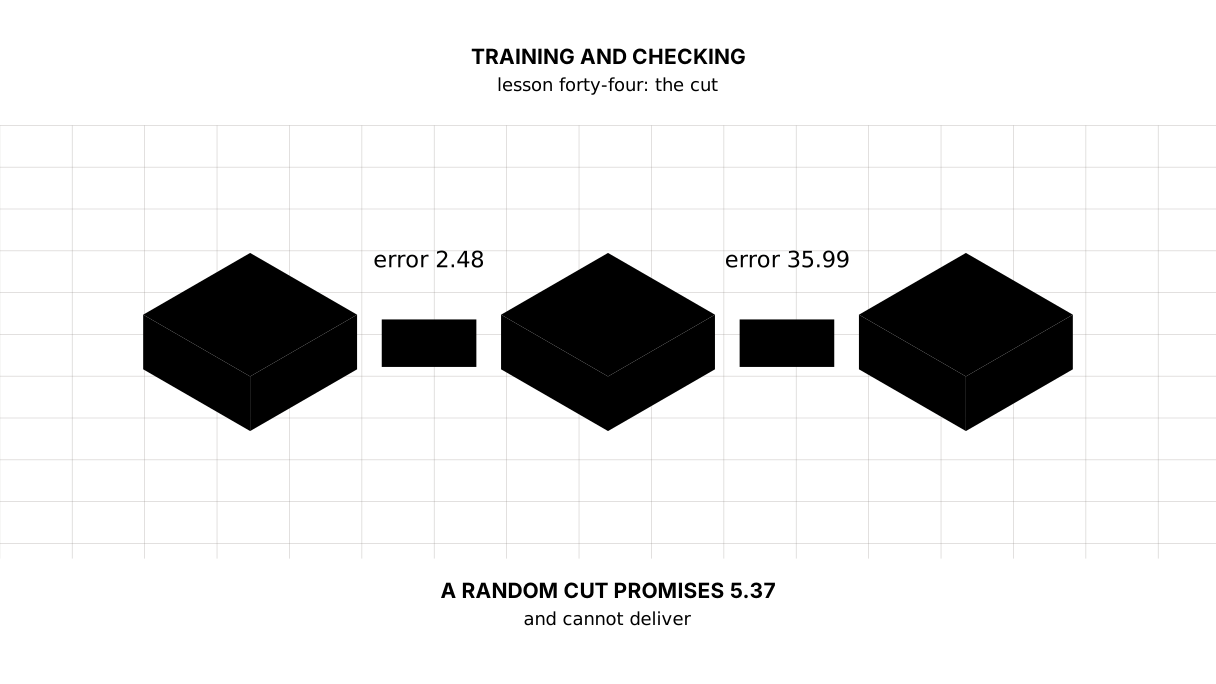
The forty-fourth lesson of the Python course. The same model on the same data: an error of 2.48 points on the years it was taught, and 35.99 on the years it never saw. A random cut instead of a cut by time shows 5.37 and lies. A fifth-degree polynomial learns almost perfectly and is three times worse than a line.
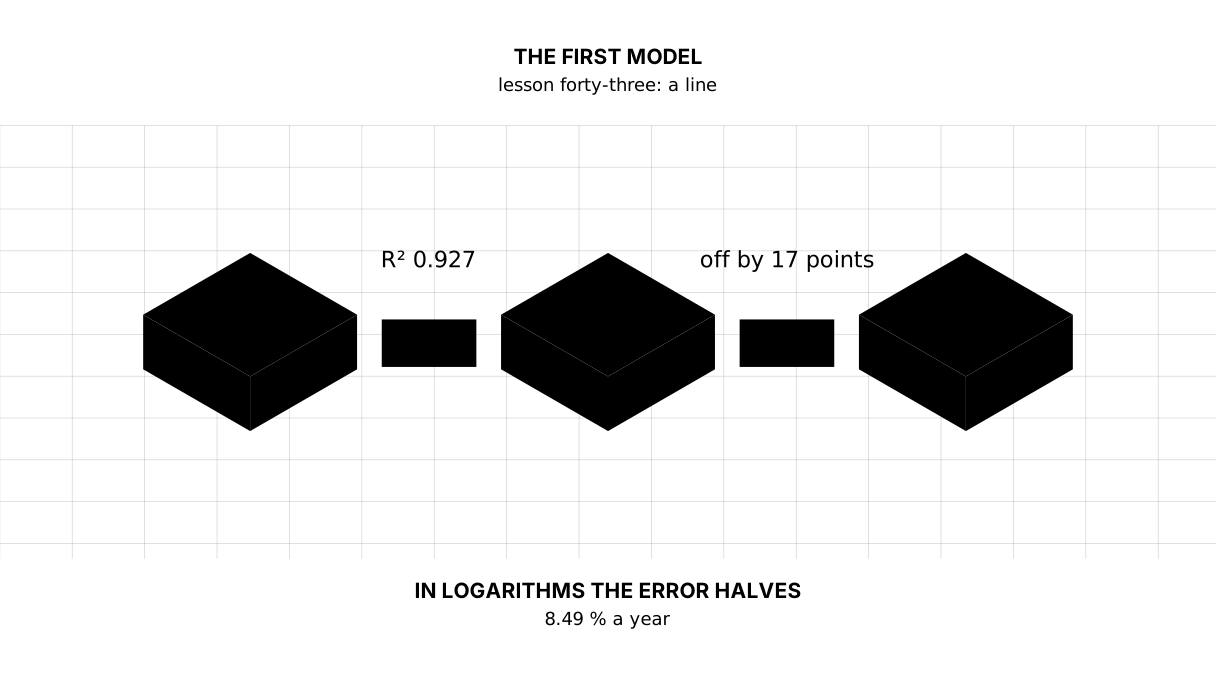
The forty-third lesson of the Python course. A line drawn through sixteen years of prices gives an R² of 0.927 and loses to the rule "same as last year" — by a hundredth of a point. Its error is not random but has a shape: plus, minus, plus. A line in logarithms is wrong by half as much, because prices multiply.
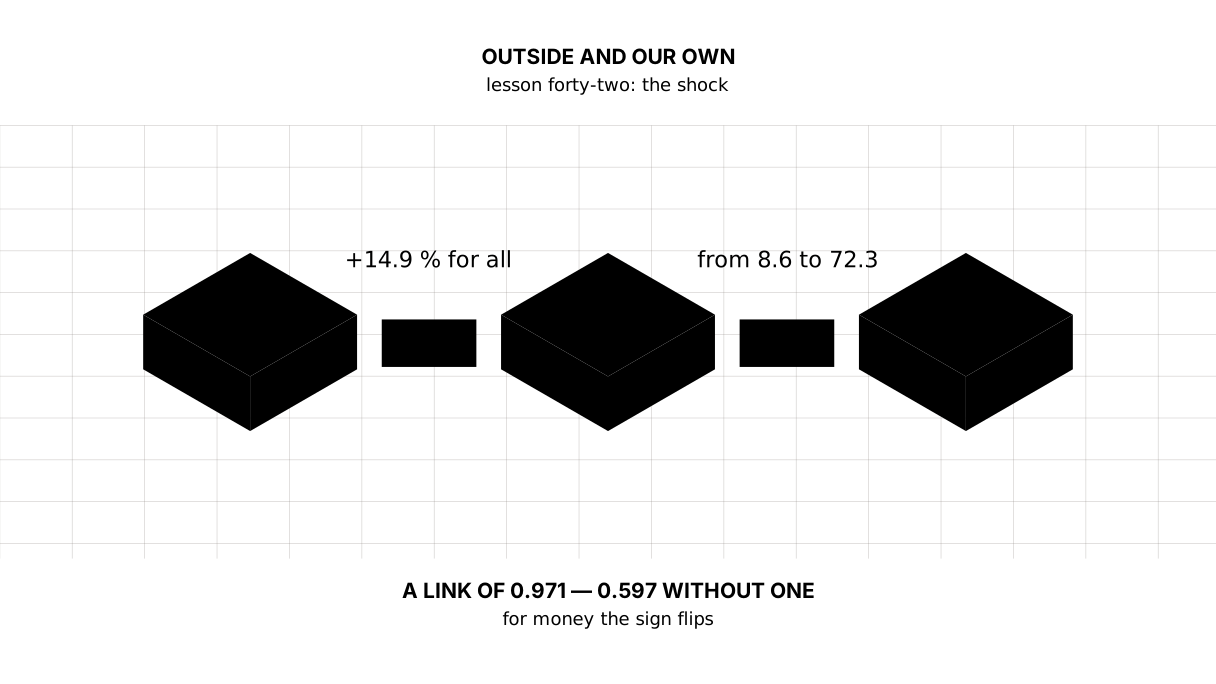
The forty-second lesson of the Python course. In 2022 world food rose by 14.9 % — the same for everybody. Inflation among ten neighbours came out between 8.6 and 72.3 %, a difference of eight times. The two usual culprits, the rate and money, are tested with a link — and one country moves the answer, while for money it flips the sign.
The forty-first lesson of the Python course. One row of an official table carries five different numbers about the same prices, and all five are right. Which question each of them answers, how to recover the weights of the official basket that the release does not print, and why the World Bank ends up with a different figure than the news.
The fortieth lesson of the Python course. Of all the money in the country the National Bank printed nine per cent; the other ninety-one are records in bank accounts that appeared at the moment a bank made a loan. The aggregates as a matryoshka, money per tenge of GDP, the money multiplier — and what the law says about all of it.
The thirty-ninth lesson of the Python course. "Inflation is 8 %, but everything doubled for me" — both sentences can be true at once, and what tells them apart is weights. The basket, each item's share of the spending, its contribution to the growth — and why a simple mean over items promises 84.6 % where the basket grew by 69.8 %.
Lesson thirty-eight of the Python course. Add up ten yearly rates and you get 92.98 % — and that is the wrong answer: prices grew by 141.98 %, because percentages multiply. The index through `cumprod`, the multiplier, the average yearly rate, and a thousand tenge of 2014 with 413 of them left by 2024.
Lesson thirty-seven of the Python course, and the start of the module about money. Ten countries, one year: the mean is 20.48 %, the median 13.88 % — and the mean is higher than what eight of the ten actually had. `mean`, `median`, `std`, the quarters, and the rule that picks a measure before anyone has seen the result.


 IT
IT