

Python: from data to your own digest Lesson 47 of 56
Where a model ends
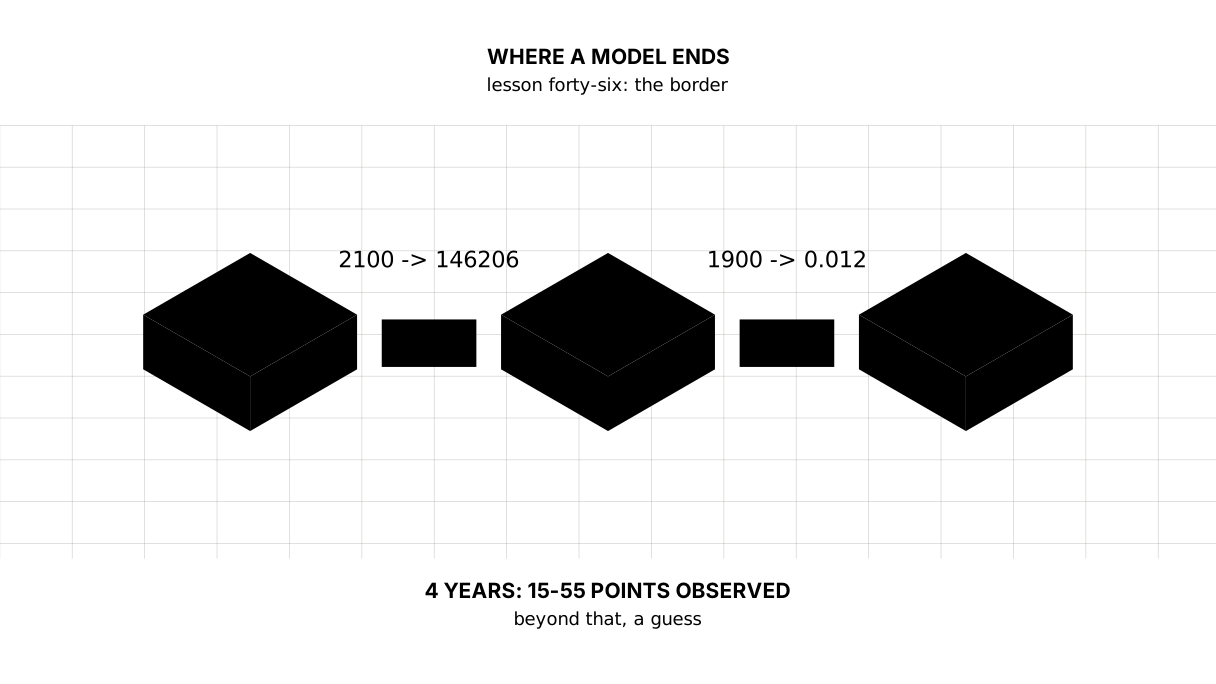
The forty-sixth lesson of the Python course and the end of the module on models. The same line promises an index of 146,206 for the year 2100 and minus a thousand for 1800 — and marks neither answer as doubtful. The border has to be written by hand: what it learned on, where it was checked, past which year it no longer holds.
Why this matters
A model always answers. That is its main property and its main danger: ask about 2100 and you get a number, ask about 1800 and you get one too, and both look equally confident.
The last three lessons taught how to count the error. This one is about what remains to be said in words once everything has been counted: what the model never saw, what it does not know in principle, and where the region ends in which it can be asked anything at all.
The whole thing first
The file is granica.py. The series are real: the price indices of Kazakhstan, Switzerland and Japan from the World Bank, all at 2010 = 100. The model is the same line through the logarithm as in lesson forty-three.
"""Lesson 46: where a model ends.

The series are real: the consumer price indices of Kazakhstan, Switzerland and
Japan, 2010 = 100, the World Bank indicator FP.CPI.TOTL. The model is the same
line through the logarithm as in lesson forty-three.
"""

import numpy as np
import pandas as pd
from sklearn.linear_model import LinearRegression

KAZAKHSTAN = pd.Series({
    2010: 100.00, 2011: 108.45, 2012: 114.09, 2013: 120.87, 2014: 129.15,
    2015: 137.77, 2016: 157.56, 2017: 169.28, 2018: 179.72, 2019: 189.30,
    2020: 202.02, 2021: 218.27, 2022: 251.07, 2023: 287.54, 2024: 312.53,
    2025: 348.12,
})
# The same years, other countries: all three have 2010 = 100, so the numbers
# can be compared.
SWITZERLAND = pd.Series({2010: 100.00, 2015: 98.17, 2020: 98.82, 2025: 105.67})
JAPAN = pd.Series({2010: 100.00, 2015: 103.59, 2020: 105.46, 2025: 118.04})


def trained_on(series):
    """A line through the log of the index. Returns an "ask about a year" function."""
    model = LinearRegression().fit(
        ((series.index.to_numpy() - 2010) / 10).reshape(-1, 1),
        np.log(series.to_numpy()))
    return lambda years: np.exp(
        model.predict(((np.array(years) - 2010) / 10).reshape(-1, 1)))


ask = trained_on(KAZAKHSTAN)

print("== A model always answers")
for year in (2030, 2040, 2100):
    print(f"  {year}: {ask([year])[0]:.1f}")
for year in (1990, 1900):
    print(f"  {year}: {ask([year])[0]:.3f}")
print("  it marked none of these answers as doubtful")

print()
print("== It knows nothing of what it never saw")
quiet = trained_on(KAZAKHSTAN[KAZAKHSTAN.index <= 2019])
for year in (2022, 2025):
    guess = float(quiet([year])[0])
    print(f"  {year}: promised {guess:.1f}, in fact {KAZAKHSTAN[year]:.2f}"
          f" — off by {KAZAKHSTAN[year] - guess:.1f}")
print("  the model learned on quiet years, and 2022 was not a quiet one")

print()
print("== It does not know which country this is about")
guess_2025 = float(ask([2025])[0])
other = pd.DataFrame({
    "in fact 2025": [KAZAKHSTAN[2025], SWITZERLAND[2025], JAPAN[2025]],
    "the model says": [round(guess_2025, 1)] * 3,
}, index=["Kazakhstan", "Switzerland", "Japan"])
other["off by"] = (other["in fact 2025"] - other["the model says"]).round(1)
print(other.to_string())
print("  the model has one feature, the year; the country is not among them")

print()
print("== One number against a range")
past = KAZAKHSTAN.index <= 2021
checked = trained_on(KAZAKHSTAN[past])
errors = (KAZAKHSTAN[~past] - checked(KAZAKHSTAN[~past].index.to_numpy())).abs()
print(errors.round(1).to_string())
print(f"  the mean: {errors.mean():.1f}; observed across four years:"
      f" {errors.min():.0f} to {errors.max():.0f} points")

print()
print("== What is not in the model at all")
model = LinearRegression().fit(
    ((KAZAKHSTAN.index.to_numpy() - 2010) / 10).reshape(-1, 1),
    np.log(KAZAKHSTAN.to_numpy()))
print("  features on the input:", model.n_features_in_)
print("  not among them: how the index was measured, who revised the series,")
print("  what a mistake costs and who needs this answer")
The output:
== A model always answers
  2030: 487.0
  2040: 1100.2
  2100: 146206.2
  1990: 18.701
  1900: 0.012
  it marked none of these answers as doubtful

== It knows nothing of what it never saw
  2022: promised 238.4, in fact 251.07 — off by 12.6
  2025: promised 297.2, in fact 348.12 — off by 50.9
  the model learned on quiet years, and 2022 was not a quiet one

== It does not know which country this is about
             in fact 2025  the model says  off by
Kazakhstan         348.12           324.0    24.1
Switzerland        105.67           324.0  -218.3
Japan              118.04           324.0  -206.0
  the model has one feature, the year; the country is not among them

== One number against a range
2022    15.1
2023    33.9
2024    39.9
2025    55.1
  the mean: 36.0; observed across four years: 15 to 55 points

== What is not in the model at all
  features on the input: 1
  not among them: how the index was measured, who revised the series,
  what a mistake costs and who needs this answer
The walk-through
A model always answers
  2100: 146206.2
  1900: 0.012
The model marked neither of these. It cannot: predict is putting a number into a formula, and a formula has no notion of “too far”.
An index of 0.012 for 1900 means everything was eight thousand times cheaper then than in 2010. In the warm-up a line without a logarithm gives minus one thousand eight hundred for 1800 — a negative price index, an impossible thing. The model does not complain, because there is nothing in it to complain with: checking for sense is not its part.
It knows nothing of what it never saw
  2022: promised 238.4, in fact 251.07 — off by 12.6
  2025: promised 297.2, in fact 348.12 — off by 50.9
A line trained on the quiet years of 2010–2019 describes a quiet world. 2022 does not fit into that world, and the error only grows from there: a model does not invent what was not in the data.
This is cured neither by complexity nor by more data of the same kind. It is cured only by naming the change of regime out loud: “the model describes years without shocks”.
It does not know which country this is about
             in fact 2025  the model says  off by
Kazakhstan         348.12           324.0    24.1
Switzerland        105.67           324.0  -218.3
The model has one feature: the year. The country is not among the features, so when asked what Switzerland’s index will be in 2025 it answers with a Kazakh number and is wrong by a factor of three.
It sounds obvious, and yet that is what most real mistakes look like: a model is applied to data that is similar in shape — the same years, the same kind of index — and what it was actually trained on is forgotten.
One number against a range
2022    15.1
2025    55.1
  the mean: 36.0; observed across four years: 15 to 55 points
Mean error is useful for comparing models. Across four check years, observed absolute errors ranged from 15 to 55 points and averaged 36. This describes only four observations, not a prediction interval: the next error may fall outside that range.
A report should therefore state the mean, the observed range and the number of check years. Do not present the minimum and maximum of four errors as guaranteed future bounds.
What is not in the model at all
features on the input: 1
Everything lesson forty-one said about revisions and definitions is outside the model. So is everything lesson forty-five said about the price of a mistake: the model does not know how a false alarm differs from a miss, because nobody told it who is asking or why.
This is not a flaw of one particular line. It is the border of the whole class: a model knows exactly the columns it was given, and nothing else.
What to write next to a number
The short line that closes the module:
price index, model trained on 2010–2021, error on the check 15–55 points, not in force past 2021
Four facts: what it counts, what it learned on, how far it is wrong, where it ends. A line like that can stand under any number in a report, and in the task a program assembles it — out of measurements rather than out of politeness.
The lesson map
Say it in your own words
Answer out loud or on paper without looking. The answers are at the end of the lesson.
- Why does a model not warn that the year 2100 is too far away?
- What does “it does not know which country this is about” mean when the data is of the same kind?
- Why does a range of error go into a report rather than a mean?
Warm-up
Three short steps before the task: predict, fill in, fix. The answers are at the end of the lesson, but answer for yourself first.
1. Predict. What does the program print for the year 1800?
import numpy as np
from sklearn.linear_model import LinearRegression

years = np.array([[2020], [2021], [2022], [2023]])
index = np.array([100.0, 108.0, 117.0, 126.0])
model = LinearRegression().fit(years, index)
print("2024:", round(float(model.predict(np.array([[2024]]))[0]), 1))
print("1800:", round(float(model.predict(np.array([[1800]]))[0]), 1))
2. Fill in the blank. In place of ... check whether the model has seen such a year.
# the model answers only about the years it has seen
first, last = 2010, 2021
for year in (2015, 2030):
    known = ...
    print(year, "inside the data" if known else "past the edge of the data")
3. Fix it. The program prints a prediction for 2025 as though it were a measurement.
# next to the answer: what it learned on and how far it is in force
answer, first, last = 293.1, 2010, 2021
print(f"2025: {answer}")
The task
Required. Assemble a card for the model: which years it learned on and how many points that is, which years it was checked on and what range it is wrong by, how many features it has and where it stops being in force. Then make the model answer only about known years and say “past the edge of the data” about the rest — and show what it would have said without that border. At the end assemble one line for a report, entirely out of what was measured.
The expected output:
== The model card
  trained on: 2010-2021, 12 points
  checked on: 2022-2025, error from 15 to 55 points
  features on the input: 1
  in force for: 2010-2021 — past that a guess begins

== Answers inside and outside
  2015: 142.3
  2021: 219.5
  2025: past the edge of the data, the model saw 2010-2021
  2030: past the edge of the data, the model saw 2010-2021

== What it would say without the border
  2025: 293.1
  2030: 420.5
  2100: 66029.9
  the same numbers, only now it shows that this is extrapolation

== An honest line for a report
  price index, model trained on 2010-2021, error on the check 15-55 points, not in force past 2021
Done means: the output matches line for line; the border lives in the model’s code rather than in the head of whoever calls it; going past the edge takes an explicit argument; the line for the report is assembled from numbers rather than typed by hand.
On your own data. Take any model of your own — even a monthly mean — and write the same four-fact line under it. If even one of them cannot be filled in with a number, that is exactly where the model ends earlier than you thought.
If you want more.
- Add to the card the share of years where the error passed ten points: one number more honest than a mean.
- Make
askreturn a pair, the answer and a warning, rather than a number — and see how the code that calls it changes. - Train the model on Switzerland and ask it about Kazakhstan. The error will be a mirror image, which is a good way to be sure the problem is not the country but what the model does not know.
Where this goes in the project
Step twenty-four, the last of the module: the digest writes down what it does not say.
A list appears at the foot of the page, and not a line of it is typed by hand. esep.shekteu takes every figure from the table that produced it:
 • no forecast: on its own years the trend is off by up to 3.55 points
 • the link between prices and money was not counted: 2 countries, 8 needed
 • the country with no money figure: RUS
 • years: up to 2025; about the year after it the report says nothing
The point is exactly that the list is assembled from the data. A caveat written once in a footer is not reread six months later, and it is the first thing to start lying. A line that takes its figure from the table above it changes along with it.
This is the cheapest part of the whole digest — one function and four lines on a page. And it is what makes a report different from a claim.
The answers
To the questions
- Because
predictis a substitution into a formula, and a formula has no notion of distance from the data. The border is known not to the model but to whoever trained it; if they did not write it down, it exists nowhere. - That the feature “country” is not part of the model: it saw only a year and Kazakhstan’s index. Data of a similar shape — the same years, the same kind of index — does not make it a model of Switzerland, and an error of 218 points shows it.
- Because a mean sounds like a measurement, while over four years the error spread from 15 to 55 points. A range says what is there; a mean says more than is known.
To the warm-up
- The line goes down to the left for ever, so for 1800 it gives a negative price index — a quantity that does not exist. The model knows nothing about that.
2024: 134.5
1800: -1814.3
first <= year <= last. The border is a comparison with what the model saw, not a guess by whoever calls it.
# the model answers only about the years it has seen
first, last = 2010, 2021
for year in (2015, 2030):
    known = first <= year <= last
    print(year, "inside the data" if known else "past the edge of the data")
2015 inside the data
2030 past the edge of the data
- A number on its own says nothing about where it came from. Next to it go the years of training and a note that this is extrapolation.
# next to the answer: what it learned on and how far it is in force
answer, first, last = 293.1, 2010, 2021
print(f"2025: {answer} (model trained on {first}-{last}, this is extrapolation)")
2025: 293.1 (model trained on 2010-2021, this is extrapolation)
To the task
The important thing in the task is that the border lives inside ask rather than in the memory of whoever calls it. A model that refuses to answer about 2030 by itself protects not itself but the person who picks this code up six months from now and does not read what it was trained on.
And look at the “without the border” block: the same numbers, 420.5 and 66029.9, have gone nowhere and are still available — but now they have to be fetched with an explicit argument. The difference between “the model said” and “I asked it to go past the edge” costs one line of code.
Sources
- LinearRegression, scikit-learn — the
predictthat has no notion of “too far”. - Model Cards for Model Reporting — the paper that started the habit of writing a card for a model: what it learned on, where it was checked, where it does not apply.
- Consumer price index, World Bank — the series of the three countries the lesson is built on.
If you have found a mistake or a typo in this article, tell us about it
Comments (0)
Log in to leave a comment →
No comments yet. Be the first.