

Python: from data to your own digest Lesson 26 of 56
DataFrame and Series: labels instead of numbers
The twenty-fifth lesson of the Python course. A table whose rows carry labels does not answer the way a list does: `loc` takes by label, `iloc` by number, and two series are added by year rather than by position. `DataFrame` and `Series`, the index, slices whose ends differ, and the `NaN` that appears on its own.
Why this matters
The last lesson ended with a rule: a table with more than one question to it — take pandas. This one is about what that table is made of.
The difference from a list is labels. A list has only numbers: the third element, the seventh. A table has column names and row labels, and every answer arrives carrying them. The year of a maximum comes back as a year, not as a position. Two series are added by year even when one of them is shorter. That, and not speed, is what changes how the program gets written.
The whole thing first
The file is tablica.py. Inflation in three countries over four years — World Bank figures, rounded to one decimal.
"""Lesson 25: a table held as a table.

Inflation in three countries over four years. The same series sits in a table as
columns, the rows carry labels, and everything else follows from the labels.
"""

import pandas as pd

# Inflation, % a year. World Bank figures, rounded to one decimal.
data = {
    "KZ": [8.0, 15.0, 14.5, 8.7],
    "UZ": [10.8, 11.4, 10.0, 9.6],
    "RU": [6.7, 13.7, 5.9, 8.4],
}
df = pd.DataFrame(data, index=[2021, 2022, 2023, 2024])
df.index.name = "year"
print(df)

print()
print("== what it is made of")
print("shape:", df.shape, "| columns:", list(df.columns))
print("row labels:", df.index.tolist())
print(df.dtypes)

print()
print("== a column is a Series")
kz = df["KZ"]
print("type:", type(kz).__name__, "| labels:", kz.index.tolist())
print(kz)

print()
print("== a row by label and a row by number")
print("loc[2022]:", df.loc[2022].to_dict())
print("iloc[1]:  ", df.iloc[1].to_dict())
print("one cell:", df.loc[2023, "UZ"])
print("loc[2022:2024] years:", df.loc[2022:2024].index.tolist(), "-- the end is included")
print("iloc[1:3] years:     ", df.iloc[1:3].index.tolist(), "-- the end is not")

print()
print("== a new column is computed from the old ones")
df["average"] = df.mean(axis=1).round(2)
print(df)

print()
print("== addition goes by label, not by position")
part = pd.Series([1.0, 2.0], index=[2023, 2024])
print(df["KZ"] - part)
It prints:
        KZ    UZ    RU
year
2021   8.0  10.8   6.7
2022  15.0  11.4  13.7
2023  14.5  10.0   5.9
2024   8.7   9.6   8.4

== what it is made of
shape: (4, 3) | columns: ['KZ', 'UZ', 'RU']
row labels: [2021, 2022, 2023, 2024]
KZ    float64
UZ    float64
RU    float64
dtype: object

== a column is a Series
type: Series | labels: [2021, 2022, 2023, 2024]
year
2021     8.0
2022    15.0
2023    14.5
2024     8.7
Name: KZ, dtype: float64

== a row by label and a row by number
loc[2022]: {'KZ': 15.0, 'UZ': 11.4, 'RU': 13.7}
iloc[1]:   {'KZ': 15.0, 'UZ': 11.4, 'RU': 13.7}
one cell: 10.0
loc[2022:2024] years: [2022, 2023, 2024] -- the end is included
iloc[1:3] years:      [2022, 2023] -- the end is not

== a new column is computed from the old ones
        KZ    UZ    RU  average
year
2021   8.0  10.8   6.7     8.50
2022  15.0  11.4  13.7    13.37
2023  14.5  10.0   5.9    10.13
2024   8.7   9.6   8.4     8.90

== addition goes by label, not by position
year
2021     NaN
2022     NaN
2023    13.5
2024     6.7
dtype: float64
Going through it
Two things, not one
A DataFrame is a table: columns with names, rows with labels. A Series is one column: values plus those same labels. Everything else follows from the pair.
df["KZ"] returns a Series, and its labels are the table’s: the years. Not a list of numbers you have to keep the years for, but numbers with their years attached. Which is why kz.index.tolist() prints [2021, 2022, 2023, 2024] and not [0, 1, 2, 3].
df.dtypes is a Series as well: column names on the left, their types on the right. Hence the dtype: object in the last line of that block — the types themselves are not numbers but objects, and a column of those has the type “anything at all”.
The index is labels, not order
We passed index=[2021, 2022, 2023, 2024], and from that point a row is called by a year. Not “row zero” but “twenty twenty-one”. The index can be named (df.index.name = "year"), and then the table prints with that name in the corner.
From this comes the difference everybody trips over:
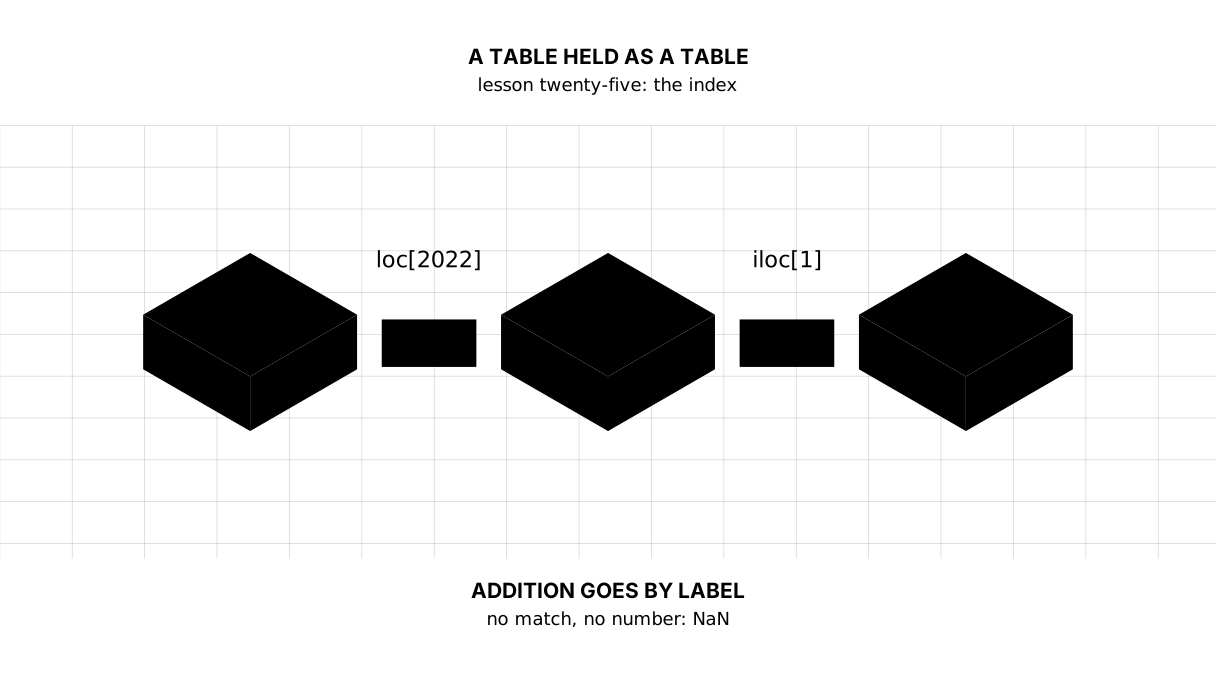
df.loc[2022]— the row by label. The year 2022.df.iloc[1]— the row by number. The second one along.
In our table those are the same row, which is exactly what makes the example treacherous: while the labels run from zero in order, the difference is invisible. It shows up the moment the rows are sorted or filtered.
The second consequence is slices. df.loc[2022:2024] gives three years: with labels the end is included, because “from 2022 to 2024” means precisely that in human speech. df.iloc[1:3] gives two: with numbers the end is excluded, like the ordinary list slice from lesson five. The same notation, two different rules — because the questions are different.
A cell is taken in one go: df.loc[2023, "UZ"] — the row’s label first, then the column’s name.
A new column is an expression, not a loop
df["average"] = df.mean(axis=1).round(2) adds a column. axis=1 means “across the row”: compute over the three countries for each year. Without axis it would count down the columns — the average over all years for each country, which is a different question.
A column with a new name is created by assignment, a column with an existing one is replaced. That is the single place where df["name"] = ... behaves like a dictionary.
Labels are added together, they are not lined up
Here is the thing the lesson exists for:
part = pd.Series([1.0, 2.0], index=[2023, 2024])
df["KZ"] - part
The result is four rows, two of them NaN. pandas does not subtract “the first from the first”: it matches labels. part has no 2021 and no 2022 — so for those years there is no answer, and NaN stands there instead.
Compare with lesson eight, where zip joined two series by position rather than by year: the shorter one silently cut the longer, and the mistake looked like a correct answer. Here it is the other way round — labels that do not match are visible at once, because they are printed.
NaN is not a zero and not a gap in your own code: it is a value meaning “there is no number here”. It is contagious in arithmetic (NaN + 5 gives NaN) and invisible to mean(), which simply passes over it. What to do about it is the subject of the lesson on dirty data; for now it is enough to know where it comes from: labels that did not match.
What to look at first
When a table arrives from somebody else, the first three questions are always the same:
df.shape— how many rows and columns;df.dtypes— what pandas takes each column to be (a number? a string? a date?);df.head(3)— what it looks like.
The fourth question is df.index: what the rows are labelled by. Half of the oddities in somebody else’s code are explained by an index that was forgotten about.
The map of this lesson
Say it in your own words
Without looking, answer out loud or on paper. The answers are at the end of the lesson.
- How does
locdiffer fromiloc, and why are their slice rules different? - What does
df["KZ"]return, and how is that different from a list of numbers? - Where did the
NaNin the difference of two series come from, if both are numbers?
The warm-up
Three short steps before the exercise: predict, fill in, fix. The answers are at the end, but answer for yourself first.
1. Predict. What does this program print?
import pandas as pd

rates = pd.Series({"KZ": 8.0, "UZ": 10.8, "RU": 6.7})
print(rates["UZ"])
print(rates.index.tolist(), "| average:", round(rates.mean(), 2))
print(rates[rates > 7])
2. Fill in the blank. In place of ... put labels such that the difference is computed for both years instead of coming out as NaN.
# the labels of the two series have to match, or there is nothing to subtract
import pandas as pd

a = pd.Series([14.5, 8.7], index=[2023, 2024])
b = pd.Series([10.0, 9.6], index=[...])
print((a - b).round(1).tolist())
3. Fix it. The program goes for the row of 2022 and raises KeyError: 2022. Replace one lookup.
# square brackets on a table ask about a column, and we want a row
import pandas as pd

df = pd.DataFrame({"KZ": [15.0, 14.5], "UZ": [11.4, 10.0]}, index=[2022, 2023])
print(df[2022].to_dict())
The exercise
Required. Take the same inflation table from the lesson. Answer three questions, each one by asking the labels rather than by looping:
- In which year did inflation peak in each country, and how high was it (
idxmaxreturns the label, which here is the year). - How many times prices grew over the four years in each country: the product of
(1 + i/100)down the column. - Which year was the calmest by the average of the three countries (
idxmin).
The expected output:
the table:
        KZ    UZ    RU
year
2021   8.0  10.8   6.7
2022  15.0  11.4  13.7
2023  14.5  10.0   5.9
2024   8.7   9.6   8.4

the peak per country:
  KZ: 2022 (15.0)
  UZ: 2022 (11.4)
  RU: 2022 (13.7)

prices over four years grew:
  KZ: 1.55 times
  UZ: 1.49 times
  RU: 1.39 times

the calmest year: 2021 (average 8.50)
Done when: the output matches line for line; the peak year comes out of idxmax rather than out of a search loop; the growth is a product rather than a sum of percentages; the calm year is found from the average of the three countries rather than from one.
On your own data. Take any series of yours by year or by month — expenses, sales, a rate, anything — and build a Series out of it with a meaningful index. Find the peak and the trough with idxmax and idxmin. Check that the answer came back as a label rather than a number: if it came back as a number, you did not set the index.
If you feel like it.
- Reorder the rows (
df.sort_values("KZ")) and watchloc[2022]andiloc[1]part company afterwards. - Build the same table from a list of dictionaries (
pd.DataFrame([{...}, {...}])) and compare what happened to the index. - Do
df.Tand explain to yourself what the columns and the labels have become.
Where this fits the project
Step seven: the digest stops holding its series in a dictionary. sholu/esep.py builds a DataFrame out of it with the years as labels, and three loops disappear:
- the average that had to be taught to skip the years without a figure —
mean()skips them itself; - the count of the gaps —
isna().sum(); - the search for the maximum that had to drag its year along —
idxmax()is the year.
The disk is untouched for now: the CSV is still written and read by the csv module. read_csv and to_csv are the next lesson.
Still open. The digest’s index is a year as a number rather than a date; for a monthly series that will no longer do, and the lesson on time in a table will have to move to real dates.
The answers
To the questions
locasks by label,ilocby number. The slice rules differ because the questions differ: “from 2022 to 2024” in human speech takes in 2024, while a slice by number is an ordinary Python slice, whose end is left out.- A
Seriesis a column: values plus labels. It differs from a list in that every number knows its own year, and that knowledge survives sorting, filtering and arithmetic. - From labels that did not match. The second series has no 2021 and no 2022, so for those years no difference exists, and pandas puts
NaNthere rather than silently dropping the rows or shifting the numbers.
To the warm-up
- A lookup by label gives a number,
indexgives the list of labels, and a comparison picks out the rows where the condition holds:rates > 7produces a series of yes-or-no, and the table is filtered with it.
10.8
['KZ', 'UZ', 'RU'] | average: 8.5
KZ     8.0
UZ    10.8
dtype: float64
index=[2023, 2024]. The numbers on their own mean nothing: 2023 is subtracted from 2023, not the first from the first.
import pandas as pd

a = pd.Series([14.5, 8.7], index=[2023, 2024])
b = pd.Series([10.0, 9.6], index=[2023, 2024])
print((a - b).round(1).tolist())
[4.5, -0.9]
df[2022]asks about a column named2022, and there is no such column — hence theKeyError. The row is taken withdf.loc[2022].
import pandas as pd

df = pd.DataFrame({"KZ": [15.0, 14.5], "UZ": [11.4, 10.0]}, index=[2022, 2023])
print(df.loc[2022].to_dict())
{'KZ': 15.0, 'UZ': 11.4}
A rule worth keeping: square brackets on a table are about columns; loc and iloc are about rows.
To the exercise
Growth is a product, not a sum: 8 % and 15 % of inflation one after the other give not 23 % but 1.08 × 1.15 = 1.242, that is 24.2 %. In pandas that is (1 + df / 100).prod() — the division and the addition apply to the whole table at once, and prod() multiplies down the column.
idxmax() returns a label rather than a position, so the year prints itself. Had the index not been set, a row number would have come back — and you would have had to work out which year that was.
Sources
- Introduction to pandas data structures —
SeriesandDataFrameat first hand. - Indexing and selecting data — the section on
locandiloc, including the rule about the ends of slices. - Consumer price inflation, World Bank — the source of this lesson’s numbers.
If you have found a mistake or a typo in this article, tell us about it
Comments (0)
Log in to leave a comment →
No comments yet. Be the first.