

Python: from data to your own digest Lesson 27 of 56
Reading and writing: CSV, JSON and SQL in one line
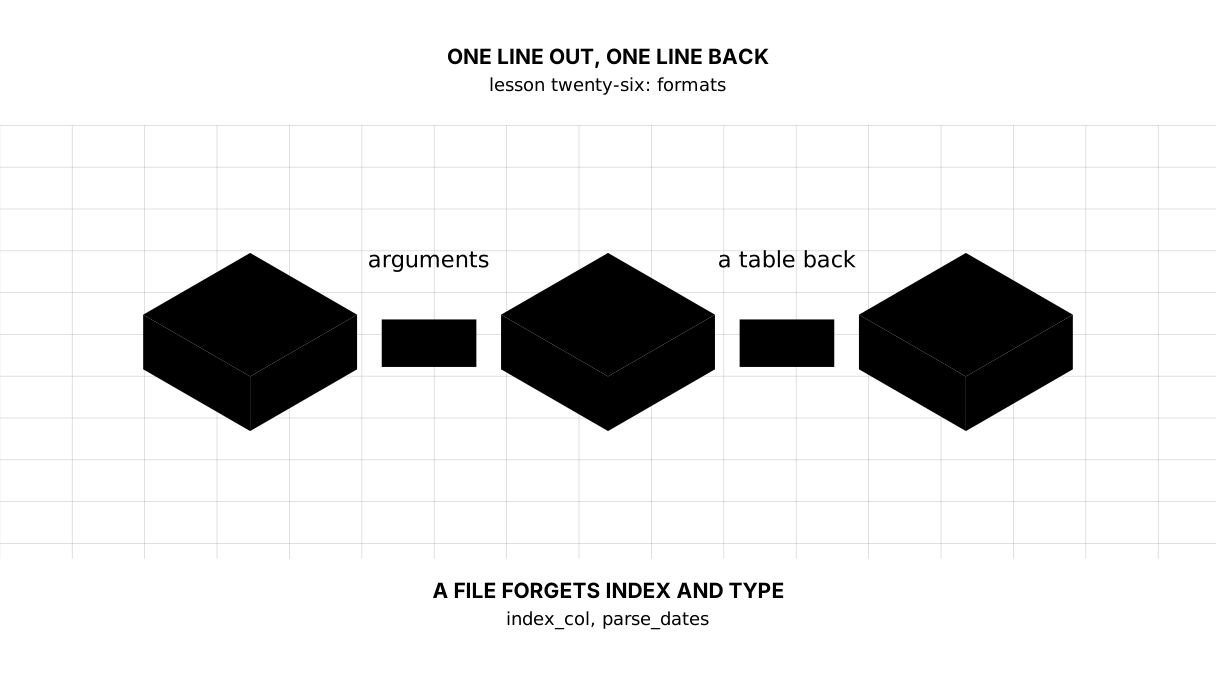
The twenty-sixth lesson of the Python course. Somebody else's file means a separator, a comma inside the decimals, a BOM and its own mark for a missing value; in a loop you have to remember every one of them, and in `read_csv` they are arguments. `read_csv`, `to_csv`, `read_sql` and `to_sql` — and what a file does not remember about a table.
Why this matters
Lesson twelve taught reading a CSV with the csv module: row by row, every number turned from text by hand. That is the right tool when the file is one and small.
But other people’s files arrive in different shapes. Out of Excel — with semicolons instead of commas, and commas inside the decimals. Out of an accounting department — with a space in the thousands and “n/a” where a value should be. Out of an old system — with a BOM at the front. Each of those small things becomes a line of its own inside a loop, a line you have to remember; forgotten, it becomes a quietly wrong answer.
In pandas all of it is arguments to one function. This lesson is about which ones.
The whole thing first
The file is formaty.py. One table leaves for three formats and comes back.
"""Lesson 26: reading and writing -- CSV, JSON, SQL.

The same table leaves for three formats and comes back. What survives the trip,
and what is lost along the way.
"""

import sqlite3
from pathlib import Path

import pandas as pd

HERE = Path(__file__).resolve().parent

# Inflation, % a year. World Bank figures; 2025 has not been counted yet.
df = pd.DataFrame(
    {"KZ": [8.0, 15.0, 14.5, 8.7, None], "UZ": [10.8, 11.4, 10.0, 9.6, None]},
    index=[2021, 2022, 2023, 2024, 2025],
)
df.index.name = "year"
print(df)

print()
print("== CSV: one line instead of a loop")
csv_path = HERE / "inflation.csv"
df.to_csv(csv_path)
print(csv_path.read_text(encoding="utf-8"), end="")

print()
print("== and back")
plain = pd.read_csv(csv_path)
print("columns:", list(plain.columns), "| labels:", plain.index.tolist())
back = pd.read_csv(csv_path, index_col="year")
print("columns:", list(back.columns), "| labels:", back.index.tolist())
print("same as the original:", back.equals(df))

print()
print("== a gap stayed a gap")
print("empty cells:", int(back.isna().sum().sum()), "| in the file that is:", repr(csv_path.read_text(encoding="utf-8").splitlines()[-1]))

print()
print("== what a file does not remember: the type")
rates = pd.DataFrame({"day": pd.to_datetime(["2026-01-15", "2026-02-15"]), "rate": [512.3, 519.8]})
rates_path = HERE / "rates.csv"
rates.to_csv(rates_path, index=False)
print(rates_path.read_text(encoding="utf-8"), end="")
print("read as it comes:", dict(pd.read_csv(rates_path).dtypes.astype(str)))
print("with parse_dates: ", dict(pd.read_csv(rates_path, parse_dates=["day"]).dtypes.astype(str)))

print()
print("== JSON: the same series, another envelope")
json_path = HERE / "inflation.json"
df.to_json(json_path, orient="index")
text = json_path.read_text(encoding="utf-8")
print("length:", len(text), "characters, the start:")
print(text[:88], "…")

print()
print("== SQL: the table goes into a database and comes back as a query")
db = sqlite3.connect(HERE / "digest.db")
df.reset_index().to_sql("inflation", db, if_exists="replace", index=False)
high = pd.read_sql("SELECT year, KZ FROM inflation WHERE KZ > 10 ORDER BY year", db)
print(high)
db.close()
It prints:
        KZ    UZ
year
2021   8.0  10.8
2022  15.0  11.4
2023  14.5  10.0
2024   8.7   9.6
2025   NaN   NaN

== CSV: one line instead of a loop
year,KZ,UZ
2021,8.0,10.8
2022,15.0,11.4
2023,14.5,10.0
2024,8.7,9.6
2025,,

== and back
columns: ['year', 'KZ', 'UZ'] | labels: [0, 1, 2, 3, 4]
columns: ['KZ', 'UZ'] | labels: [2021, 2022, 2023, 2024, 2025]
same as the original: True

== a gap stayed a gap
empty cells: 2 | in the file that is: '2025,,'

== what a file does not remember: the type
day,rate
2026-01-15,512.3
2026-02-15,519.8
read as it comes: {'day': 'str', 'rate': 'float64'}
with parse_dates:  {'day': 'datetime64[us]', 'rate': 'float64'}

== JSON: the same series, another envelope
length: 143 characters, the start:
{"2021":{"KZ":8.0,"UZ":10.8},"2022":{"KZ":15.0,"UZ":11.4},"2023":{"KZ":14.5,"UZ":10.0}," …

== SQL: the table goes into a database and comes back as a query
   year    KZ
0  2022  15.0
1  2023  14.5
Going through it
One line out, one line back
df.to_csv(path) writes the whole table: a header from the column names, the row labels as the first column, gaps as empty cells. pd.read_csv(path) reads it back. No writer.writerow in a loop and no int(row["year"]) — pandas works the types out from what it finds.
Compare with lesson twelve: the same work took fifteen lines there, and every one of them was a place to get it wrong.
What a file does not remember
A file is text. It forgets two things, and both cost mistakes.
The index. Without a hint, read_csv treats the first column as an ordinary column: the row labels became a column called year, and the numbers [0, 1, 2, 3, 4] took their place. Say index_col="year" and the year is a label again. The back.equals(df) check in the example prints True only after that.
The type. 2026-01-15 in a file is a string. pandas will read it as one, and day.dt.month will not work: a string has no month. parse_dates=["day"] turns it into a date, and the output shows str becoming datetime64[us]. The same goes for codes: dtype={"kod": str} saves the leading zero that otherwise disappears along with the turn into a number.
In this example the gap survived the trip: an empty cell read back as NaN and NaN wrote out as an empty cell — hence exactly two empty cells, the same two. But that is luck rather than a property of the column: in a text column an empty cell and an empty string are indistinguishable, and the words NA, N/A, nan and a dozen more are treated as gaps by read_csv out of the box — including NA, the real country code of Namibia. What counts as a gap is better stated outright: na_values=[...] and keep_default_na=False.
The arguments that cover almost any file somebody sends you
| Argument | When it is needed |
|---|---|
sep=";" |
Excel in our part of the world writes with semicolons |
decimal="," |
512,3 is a number, not a string |
thousands=" " |
1 200,50 is one too |
encoding="utf-8-sig" |
the BOM at the front of a file out of Excel |
na_values=["n/a", "-"] |
the sender has their own mark for a gap |
usecols=[...] |
not dragging in twenty columns for the sake of two |
index_col="year" |
a label instead of a spare column |
parse_dates=["day"] |
text turned into a date |
dtype={"kod": str} |
keeping the leading zero |
nrows=5 |
a look inside a gigabyte file without reading it |
The last one is worth making a habit. Before reading somebody’s file whole, read five rows and look at dtypes. That is thirty seconds and half of the misunderstandings that were coming.
Three matter on the way out:
index=False— if the row labels are just numbers, they have no business in a file;float_format="%.2f"— so that a report does not carry8.041471000000001;na_rep="n/a"— when the recipient needs a mark rather than an emptiness.
JSON: when read_json, and when json.load
to_json and read_json work when the JSON is a flat table, and the main question there is orient: how exactly to lay the rows and columns out. In the example orient="index" gave a dictionary of “year → row”.
But the bank’s answer from lesson eighteen is not a table: it has nested objects, a wrapper and metadata around the data. That is easier to take apart with json.load, which is what we did, and to build a table from the list of dictionaries it leaves. For nested structures there is pd.json_normalize, which spreads them into columns.
The rule is about the shape rather than the owner: flat JSON that is already a table goes to read_json; nested JSON is taken apart with json.load or json_normalize. Somebody else’s API usually sends the second kind and your own to_json the first, but it is the structure that decides, not who sent the file.
SQL: to_sql and read_sql
The connection comes from where it came from in lesson twenty-one — from sqlite3. to_sql puts a table into the database, read_sql brings a query’s result back as a table.
This does not replace lesson twenty-two; it continues it. Grouping, joining and filtering are still better left to the database: it can do them over data that will not fit in memory, and it hands you a small result instead of a large one. read_sql is a door between two worlds, not a reason to fall out of love with GROUP BY.
Two warnings. Values go into a query through params= rather than through string formatting — the lesson on SQLite shows why. And about the connection: sqlite3 is taken as it is, while PostgreSQL and the rest are reached through SQLAlchemy or ADBC — the call looks the same either way, only what you handed to con changes.
The map of this lesson
Say it in your own words
Without looking, answer out loud or on paper. The answers are at the end of the lesson.
- What is lost when a table is written to a CSV, and how is it brought back on the way in?
- When is JSON better read with
json.loadthan withread_json? - Why leave
GROUP BYto the database when pandas can group too?
The warm-up
Three short steps before the exercise: predict, fill in, fix. The answers are at the end, but answer for yourself first.
1. Predict. The file came out of Excel and was read with no arguments. What does the program print?
import io

import pandas as pd

TEXT = "year;rate\n2025;512,3\n2026;519,8\n"
df = pd.read_csv(io.StringIO(TEXT))
print(df)
print("shape:", df.shape, "| columns:", list(df.columns))
2. Fill in the blank. In place of ... put the arguments that give two columns and real numbers.
# the semicolon is the separator, the comma is the decimal point
import io

import pandas as pd

TEXT = "year;rate\n2025;512,3\n2026;519,8\n"
df = pd.read_csv(io.StringIO(TEXT), ...)
print("shape:", df.shape, "| columns:", list(df.columns))
print(dict(df.dtypes.astype(str)))
print(df["rate"].sum())
3. Fix it. After a round trip through a file the table has grown a spare column. Remove it with one argument.
# where Unnamed: 0 came from
import io

import pandas as pd

df = pd.DataFrame({"kind": ["food", "phone"], "amount": [1200, 4000]})
buffer = io.StringIO()
df.to_csv(buffer)
print("read back:", pd.read_csv(io.StringIO(buffer.getvalue())).columns.tolist())
The exercise
Required. The program writes “an accountant’s export” itself — a file in utf-8-sig, with semicolons, a space in the thousands, a comma in the decimals, an n/a mark and a spare note column:
year;category;amount;note
2024;food;1 200,50;
2024;phone;4 000,00;the tariff changed
2025;food;1 380,75;
2025;phone;n/a;the bill never came
Read it in one read_csv call so that the amount becomes a number, n/a becomes a gap, and the note is not read at all. Print the table, the column types and the number of gaps. Then write a clean CSV with no index, put the table into SQLite and get the sum per year with a query.
The expected output:
read:
   year category   amount
0  2024     food  1200.50
1  2024    phone  4000.00
2  2025     food  1380.75
3  2025    phone      NaN
types: {'year': 'int64', 'category': 'str', 'amount': 'float64'}
missing: 1

clean:
year,category,amount
2024,food,1200.5
2024,phone,4000.0
2025,food,1380.75
2025,phone,

by year:
 year  amount
 2024 5200.50
 2025 1380.75
Done when: the output matches line for line; everything is handled by arguments to read_csv rather than by replacements in strings; amount has the type float64 and not str; the clean file has no column of row numbers; the sum per year comes from a query rather than from groupby.
On your own data. Take any file somebody has sent you — a statement, an export, a report. Read five rows (nrows=5), look at dtypes and pick the arguments that make numbers numbers and dates dates. Write the result out as a clean CSV.
If you feel like it.
- Save the same table as JSON with three different
orientvalues and compare the files. - Read your file with
dtype={"kod": str}and check that the leading zero is where it was. - Put the table into SQLite and ask it a query with
WHEREandGROUP BY— the result comes back as a table.
Where this fits the project
Step eight: the disk starts speaking tables. saqtau.save is to_csv with a float_format and an empty cell for a missing year; saqtau.load is read_csv with index_col="year", so what comes off the disk is the table itself rather than a dictionary to rebuild one from. The report is written with to_csv(index=False) as well.
The note column is gone: it existed to spell out the n/a mark in words, and an empty cell says the same thing, which read_csv turns into NaN without being asked.
The network is untouched: the bank answers with one small JSON, and json.load is still the right tool for it.
Still open. The digest has no database yet: to_sql is not used in the project, though the data is ready for it. We will get there where we get to the server.
The answers
To the questions
- The index and the types. The index comes back through
index_col, the types throughparse_datesfor dates anddtypefor the columns where text has to stay text. Gaps, unlike those, survive the trip by themselves. - When the JSON is not a table: nested objects, a wrapper, metadata around the data. Then
json.loadtakes it apart, and the table is built from the list of dictionaries or throughpd.json_normalize. - Because the database works over data that is not obliged to fit in memory, and it returns a small result instead of a large one. Dragging a million rows into pandas to get five is paying the fare for something that could have stayed at home.
To the warm-up
- The default separator is a comma, so the line
2025;512,3was cut at the comma into2025;512and3. The first piece became the row label, the second the value, and every number in the table is wrong. The program did not fall over: it “successfully” read somebody else’s file incorrectly.
          year;rate
2025;512          3
2026;519          8
shape: (2, 1) | columns: ['year;rate']
sep=";", decimal=",". The first cuts the line at the right character, the second explains that a comma inside a number is its decimal point.
import io

import pandas as pd

TEXT = "year;rate\n2025;512,3\n2026;519,8\n"
df = pd.read_csv(io.StringIO(TEXT), sep=";", decimal=",")
print("shape:", df.shape, "| columns:", list(df.columns))
print(dict(df.dtypes.astype(str)))
print(df["rate"].sum())
shape: (2, 2) | columns: ['year', 'rate']
{'year': 'int64', 'rate': 'float64'}
1032.1
to_csv(buffer, index=False). The row labels here are just numbers and have no business in the file; once there, they are read as a column without a name and are given one:Unnamed: 0.
import io

import pandas as pd

df = pd.DataFrame({"kind": ["food", "phone"], "amount": [1200, 4000]})
buffer = io.StringIO()
df.to_csv(buffer)
print("with the index:", pd.read_csv(io.StringIO(buffer.getvalue())).columns.tolist())
clean = io.StringIO()
df.to_csv(clean, index=False)
print("without it:    ", pd.read_csv(io.StringIO(clean.getvalue())).columns.tolist())
with the index: ['Unnamed: 0', 'kind', 'amount']
without it:     ['kind', 'amount']
To the exercise
All four peculiarities of the file are covered by arguments to a single call: sep=";", decimal=",", thousands=" ", encoding="utf-8-sig", na_values=["n/a"] and usecols for the three columns that are wanted. The temptation to clean the file with replacements in the text is a mistake: swapping , for . ruins any comma inside a note, and the next sender’s mark for a missing value will be a different one.
The sum per year is computed by SELECT year, SUM(amount) ... GROUP BY year, because the data is already in the database and the database can do that.
Sources
- Input and output in pandas — every format at once, with examples.
- The full list of read_csv arguments — there are more than fifty; a dozen are worth knowing.
- The sqlite3 module — the connection
read_sqltakes.
If you have found a mistake or a typo in this article, tell us about it
Comments (0)
Log in to leave a comment →
No comments yet. Be the first.