

Python: from data to your own digest Lesson 39 of 56
Inflation as a multiplier: what a tenge was worth
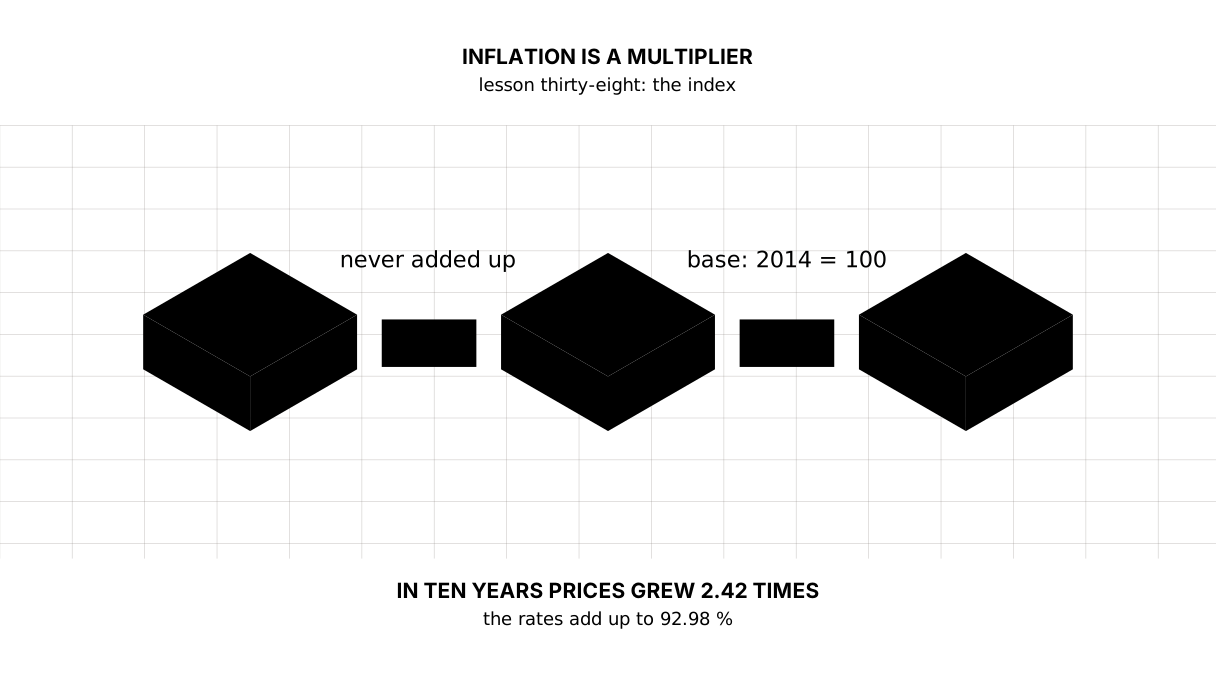
Lesson thirty-eight of the Python course. Add up ten yearly rates and you get 92.98 % — and that is the wrong answer: prices grew by 141.98 %, because percentages multiply. The index through `cumprod`, the multiplier, the average yearly rate, and a thousand tenge of 2014 with 413 of them left by 2024.
Why this is needed
Inflation is announced as a percentage for a year, and people live through years in a row. Adding ten percentages into one is the first thing that comes to mind, and it is a mistake that, over a ten-year series, is wrong by half as much again.
The right answer comes from a multiplier. Every other answer comes from the same place: how many times prices grew, what last year’s thousand is worth today, whether an income really grew or only in name.
The whole thing at once
The file multiplier.py. The rates are from the World Bank, with 2014 taken as the base.
"""Lesson 38: inflation as a multiplier -- what a tenge was worth.

Yearly percentages do not add up: they multiply. A series of rates becomes an
index, and the index answers what happened to a thousand.
The rates come from the World Bank, FP.CPI.TOTL.ZG.
"""

import pandas as pd

# Yearly inflation in Kazakhstan, per cent. 2014 is the base, so its own rate
# is not in the series: the index is counted from it.
rates = pd.Series(
    [6.68, 14.36, 7.44, 6.16, 5.33, 6.72, 8.04, 15.03, 14.53, 8.69],
    index=[2015, 2016, 2017, 2018, 2019, 2020, 2021, 2022, 2023, 2024],
    name="rate",
)

# Every year has its multiplier: 6.68 % becomes 1.0668.
factors = 1 + rates / 100
# The running product is the price index itself. The 2014 base = 100.
index = (factors.cumprod() * 100).round(2)
total = factors.prod()

print("== The price index, 2014 = 100")
print(index.to_string())

print()
print("== How many times prices grew in ten years")
print("  multiplier:", round(total, 3))
print("  growth:", round((total - 1) * 100, 2), "%")
print("  the rates added up:", round(rates.sum(), 2), "% - and that is wrong")
print("  the difference:", round((total - 1) * 100 - rates.sum(), 2), "percentage points")

print()
print("== What happened to a thousand")
kept = 1000 / total
print("  a thousand tenge in 2024 has the purchasing power that", round(kept, 2), "tenge had in 2014")
print("  lost:", round(100 - kept / 10, 2), "% of the purchasing power")
print("  to buy the same in 2024 you need:", round(1000 * total, 2), "tenge")

print()
print("== Which year counts as the average one")
geometric = total ** (1 / len(rates)) - 1
print("  yearly average by multipliers:", round(geometric * 100, 2), "%")
print("  arithmetic mean of the rates:", round(rates.mean(), 2), "%")
print("  over ten years the first gives:", round((1 + geometric) ** len(rates), 3))
print("  and the second:", round((1 + rates.mean() / 100) ** len(rates), 3))

print()
print("== A 2014 receipt in the prices of each year")
basket = 12000
print(" ", basket, "tenge of 2014 is:")
for year in (2016, 2020, 2024):
    print(f"    {year}: {round(basket * index[year] / 100, 2)} tenge")

print()
print("== The other way round: nominal money in 2014 tenge")
nominal = pd.Series({2016: 15000, 2020: 20000, 2024: 30000}, name="nominal")
real = (nominal / index[nominal.index] * 100).round(2)
print(pd.DataFrame({"nominal": nominal, "in 2014 tenge": real}).to_string())
It prints:
== The price index, 2014 = 100
2015    106.68
2016    122.00
2017    131.08
2018    139.15
2019    146.57
2020    156.42
2021    168.99
2022    194.39
2023    222.64
2024    241.98

== How many times prices grew in ten years
  multiplier: 2.42
  growth: 141.98 %
  the rates added up: 92.98 % - and that is wrong
  the difference: 49.0 percentage points

== What happened to a thousand
  a thousand tenge in 2024 has the purchasing power that 413.25 tenge had in 2014
  lost: 58.67 % of the purchasing power
  to buy the same in 2024 you need: 2419.84 tenge

== Which year counts as the average one
  yearly average by multipliers: 9.24 %
  arithmetic mean of the rates: 9.3 %
  over ten years the first gives: 2.42
  and the second: 2.433

== A 2014 receipt in the prices of each year
  12000 tenge of 2014 is:
    2016: 14640.0 tenge
    2020: 18770.4 tenge
    2024: 29037.6 tenge

== The other way round: nominal money in 2014 tenge
      nominal  in 2014 tenge
2016    15000       12295.08
2020    20000       12786.09
2024    30000       12397.72
How it works
A percentage is a multiplier
6.68 % for a year means multiplying by 1.0668. Two years in a row means multiplying twice: 1.0668 × 1.1436, not adding. Everything else follows from that.
Adding the percentages gives 92.98 % over ten years; multiplying gives 141.98 %. A difference of 49 percentage points is not a rounding error and not a subtlety: it is half the answer.
The index is a running product
(1 + rates / 100).cumprod() * 100 — the whole price index in one line. cumprod multiplies as it goes, so at every point it holds the product of every multiplier before it: 2016 is 122.00, meaning prices by that year were 1.22 times the base.
The base is the year everything is counted against. There is no right value for it: 100 is the familiar one, because then the index reads as a percentage of the base. What matters is different — the base has to be named. “An index of 241.98” without the words “2014 = 100” means nothing.
What happened to a thousand
Two questions people mix up, though there is only one multiplier:
a thousand tenge in 2024 has the purchasing power that 413.25 tenge had in 2014
to buy the same in 2024 you need: 2419.84 tenge
The first is a division by the multiplier: what today’s thousand is worth in old money. The second is a multiplication: what today’s price is for the old basket. The numbers differ (413 and 2420), the questions differ, and the multiplier is the same one.
The loss of purchasing power is counted from the first: 100 % − 41.3 % = 58.7 %. That is the price of ten years under a mattress.
The average year is geometric, not arithmetic
The average yearly rate is not the arithmetic mean of the rates but the single rate that gives the same multiplier over the same years:
yearly average by multipliers: 9.24 %
arithmetic mean of the rates: 9.3 %
The difference is small here, but it is always in one direction: the arithmetic mean of rates is never below the geometric one, and over ten years 9.3 % gives 2.433 instead of the true 2.42. The wider the rates are spread, the larger the gap — on a series with falls it becomes coarse.
Deflating: nominal money in the money of the base year
The other way round is to divide a nominal sum by the index of its own year:
      nominal  in 2014 tenge
2016    15000       12295.08
2020    20000       12786.09
2024    30000       12397.72
The nominal doubled; in 2014 money nothing changed. That is what “real income” means: sums from different years can be compared only after they have been brought to one year.
The rule is simple: any sums from different years are compared through an index and in no other way. Without it the comparison is about the currency, not about life.
The lesson map
Say it in your own words
Without looking, answer aloud or on paper. The answers are at the end of the lesson.
- Why can ten yearly rates not be added up and called the growth of prices over ten years?
- What is the difference between “what is a thousand of 2014 worth today” and “how much do I need today instead of a thousand of 2014”?
- What does “the salary tripled but grew one and a half times in real money” mean?
Warm-up
Three short steps before the exercise: predict, fill in, fix. The answers are at the end of the lesson, but answer for yourself first.
1. Predict. What does this program print?
import pandas as pd

moves = pd.Series([50, -50])
print("the percentages add up to:", moves.sum(), "%")
print("the multiplier:", round((1 + moves / 100).prod(), 3))
print("left of a thousand:", round(1000 * (1 + moves / 100).prod(), 2))
2. Fill in the blank. In place of ... put what turns a series of multipliers into an index.
# three years at ten per cent each
import pandas as pd

rates = pd.Series([10.0, 10.0, 10.0])
index = ((1 + rates / 100)... * 100).round(2)
print(index.to_list())
3. Fix it. The program adds the percentages up and calls the sum the growth of prices.
# three years in a row: 6.68, 14.36 and 7.44 per cent
import pandas as pd

rates = pd.Series([6.68, 14.36, 7.44])
print("grew by", round(rates.sum(), 2), "%")
print("that is", round(1 + rates.sum() / 100, 3), "times")
Exercise
Required. Build the price index of Kazakhstan from 2015 to 2024 (2014 = 100) and print: the index itself, the multiplier over the ten years, the growth in per cent, the sum of the rates with a note that it must not be counted that way, and the average yearly rate. Then answer the two questions about a thousand tenge of 2014. Finally, bring three years of a nominal salary to 2014 money and say how many times it grew in name and how many times it grew in fact.
The expected output:
== The index, 2014 = 100
2015    106.68
2016    122.00
2017    131.08
2018    139.15
2019    146.57
2020    156.42
2021    168.99
2022    194.39
2023    222.64
2024    241.98

== The ten years in total
  multiplier: 2.42
  growth: 141.98 %
  the rates added up (never do this): 92.98 %
  yearly average: 9.24 %

== A thousand of 2014
  buys what it then bought for: 413.25 tenge
  to buy the old basket you need: 2419.84 tenge

== A salary that tripled
      nominal  in 2014 tenge  real, % of 2016
2016   150000      122950.82             0.00
2020   250000      159826.11            29.99
2024   450000      185965.78            51.25
  the nominal grew 3.0 times
  in real money: 1.51 times
Done when: the output matches line for line; the index is built with cumprod rather than a loop with an accumulator; deflating is a function of its own that does not care what it is given; not one growth figure comes from adding percentages.
On your own data. Take a sum you paid for something regular several years ago — rent, a subscription, a fare — and work out what it would cost today by the official index. Compare that with what you pay now. The gap between those two numbers is your own answer to whether official inflation matches yours: the next lesson is exactly about that.
If you feel like it.
- Build the index with 2020 = 100 as the base and check that the multiplier for 2015–2024 did not change with the base.
- Work out how many years prices take to double at 9.24 % a year, and compare that with the “rule of seventy” (70 / rate).
- Take a series with a fall in it (a negative rate) and see what
cumproddoes with it.
Where this goes in the project
The eighteenth step: the digest gains an index.
sholu/esep.py gains indeks — per country it builds the multiplier out of the yearly rates and an index based on the first year of the series. The report page shows them as a third block: “how many times prices grew since 2021”.
What came out on the digest’s data: from 2021 to 2025 prices grew 1.595 times in Kazakhstan, 1.462 in Uzbekistan and 1.42 in Russia. Not one of those numbers can be had by adding the rates up, and not one of them equals the last year’s rate.
For the digest this is the first calculation in which every year takes part, rather than the last and the one before it. So it also brings the first check for gaps: an index only means something on an unbroken run of years, and if a year is missing, indeks says so instead of counting in silence.
Limitations. The digest’s index rests on the World Bank’s yearly rates, and those are themselves a smoothed yearly estimate. Monthly data would be more precise, and with it would come the question of seasonality; both are waiting for the lesson on reading official statistics.
Answers
Show the answers
To the questions
- Because a percentage is a multiplier, and multipliers multiply. Ten rates gave a multiplier of 2.42, that is a growth of 141.98 %, while their sum is 92.98 %. Adding answers a question nobody asked.
- The first question is about today’s thousand in old money: 1000 ÷ 2.42 = 413.25. The second is about the old basket in today’s money: 1000 × 2.42 = 2419.84. The same number works both ways, and the answers differ almost sixfold.
- That the nominal tripled but prices grew over the same years: after both sums are brought to the money of one year, a growth of 1.51 times is left. Comparing sums from different years without an index is comparing different units of measurement.
To the warm-up
- Plus fifty and minus fifty give zero as a sum and 0.75 as a product: after the rise, half is taken of something larger, and the fall is taken of something larger still.
the percentages add up to: 0 %
the multiplier: 0.75
left of a thousand: 750.0
.cumprod(). The running product is the index itself: 110, 121, 133.1 — not 110, 120, 130.
import pandas as pd

rates = pd.Series([10.0, 10.0, 10.0])
index = ((1 + rates / 100).cumprod() * 100).round(2)
print(index.to_list())
[110.0, 121.0, 133.1]
- Multiply the multipliers instead of adding the percentages:
(1 + rates / 100).prod().
import pandas as pd

rates = pd.Series([6.68, 14.36, 7.44])
print("grew", round((1 + rates / 100).prod(), 3), "times")
print("that is", round(((1 + rates / 100).prod() - 1) * 100, 2), "%")
grew 1.311 times
that is 31.08 %
To the exercise
price_index and deflate are functions not for tidiness: an index is built once and then everything is brought to it — salaries, receipts, tariffs. A function that takes a series and an index and knows nothing about what they mean works for all three.
The “real, % of 2016” column answers the question the whole count was for: the nominal grew by 200 %, the real money by 51.25 %. Both figures are true, and only the second one describes a life.
Sources
- Series.cumprod — the running product an index comes out of.
- Consumer price indices, Bureau of National Statistics of Kazakhstan — the official Kazakh indices and their base.
- Consumer price inflation, World Bank — the source of this lesson’s rates.
If you have found a mistake or a typo in this article, tell us about it
Comments (0)
Log in to leave a comment →
No comments yet. Be the first.