

Python: from data to your own digest Lesson 40 of 56
Your own inflation: your basket against the official one
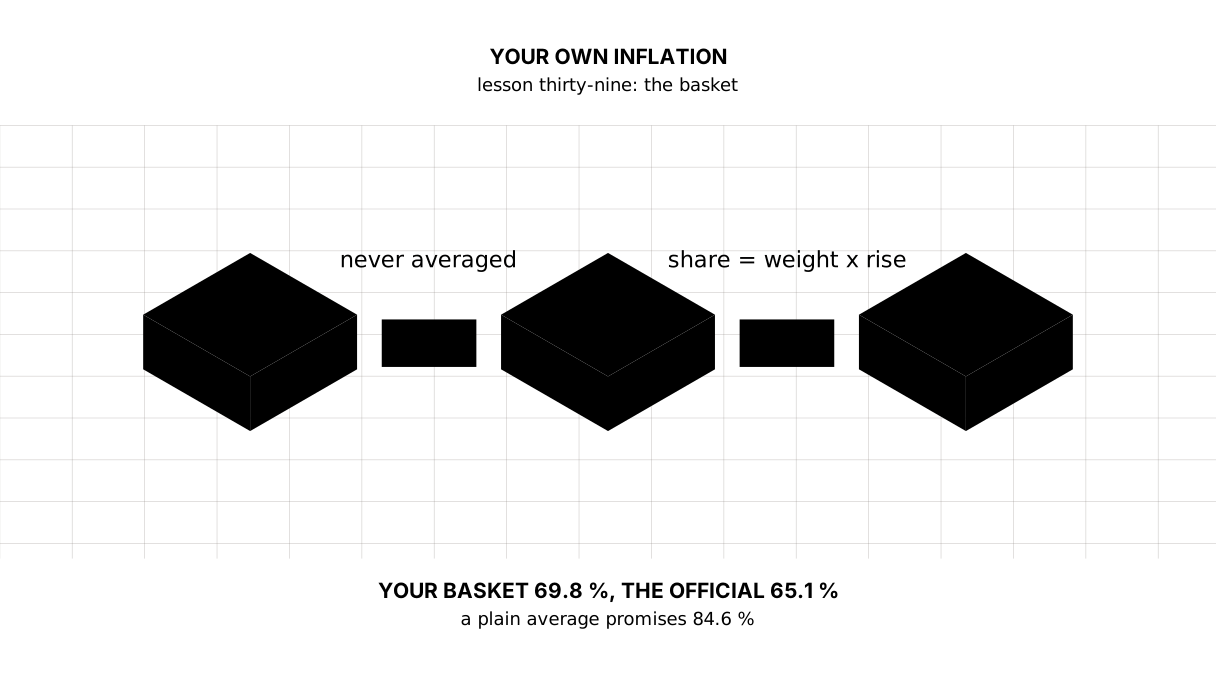
The thirty-ninth lesson of the Python course. "Inflation is 8 %, but everything doubled for me" — both sentences can be true at once, and what tells them apart is weights. The basket, each item's share of the spending, its contribution to the growth — and why a simple mean over items promises 84.6 % where the basket grew by 69.8 %.
Why this matters
The official index counts the basket of an average household. Yours is not among them: you have your own rent, your own commute, your own children and your own cat. So “the official 65 %” and “mine went up by 70 %” is not an argument — they are two different questions.
Your own inflation can be counted in one evening, if you have the receipts. It is counted with weights rather than with an average over price tags: how much room every item takes in your money.
The whole thing first
The file is sebet.py. The official multiplier here is real — the consumer price index of Kazakhstan for 2019–2024, World Bank data. The basket itself is an example: put your own receipts in, the arithmetic stays the same.
"""Lesson 39: your own inflation — your basket against the official one.

The official multiplier here is real: Kazakhstan consumer price index for
2019-2024, World Bank data. The basket is an example: put your own receipts
in, the arithmetic stays the same.
"""

import pandas as pd

# Official index (2010 = 100) at the start and the end of the five years.
OFFICIAL_2019 = 189.30
OFFICIAL_2024 = 312.53

# A sample basket: what is bought in a month, at what price then and now.
basket = pd.DataFrame(
    [
        ("bread, loaf", 20, 90, 180),
        ("milk, litre", 15, 260, 480),
        ("eggs, ten", 8, 350, 1000),
        ("meat, kg", 4, 1600, 3200),
        ("transit, ride", 40, 80, 100),
        ("internet, month", 1, 5000, 6500),
        ("rent, month", 1, 90000, 150000),
    ],
    columns=["item", "count", "was", "now"],
)

# What the item costs in the basket, then and now.
basket["then"] = basket["count"] * basket["was"]
basket["today"] = basket["count"] * basket["now"]
# Weight is the item's share of the base-year spending. Weights sum to 1.
basket["weight"] = basket["then"] / basket["then"].sum()
basket["times"] = basket["now"] / basket["was"]

print("== The basket")
print(basket[["item", "count", "was", "now", "times"]].round(3).to_string(index=False))

print()
print("== Weights: what your month is really made of")
weights = basket[["item", "weight"]].sort_values("weight", ascending=False)
print(weights.assign(**{"weight": (weights["weight"] * 100).round(1)}).to_string(index=False))

print()
print("== Three answers to one question")
personal = basket["today"].sum() / basket["then"].sum()
simple = basket["times"].mean()
official = OFFICIAL_2024 / OFFICIAL_2019
print("  the whole basket:", round(personal, 3), "→", round((personal - 1) * 100, 1), "%")
print("  simple mean over items:", round(simple, 3), "→", round((simple - 1) * 100, 1), "%")
print("  official index:", round(official, 3), "→", round((official - 1) * 100, 1), "%")

print()
print("== Who raised your basket")
basket["contribution"] = basket["weight"] * (basket["times"] - 1)
contribution = basket[["item", "weight", "times", "contribution"]].sort_values("contribution", ascending=False)
print(contribution.round(3).to_string(index=False))
print("  contributions add up to:", round(basket["contribution"].sum(), 3), "— the basket growth")

print()
print("== Spending per month")
print("  then:", basket["then"].sum(), "tenge")
print("  today:", basket["today"].sum(), "tenge")
print("  difference:", basket["today"].sum() - basket["then"].sum(), "tenge a month")
The output:
== The basket
           item  count   was    now  times
    bread, loaf     20    90    180  2.000
    milk, litre     15   260    480  1.846
      eggs, ten      8   350   1000  2.857
       meat, kg      4  1600   3200  2.000
  transit, ride     40    80    100  1.250
internet, month      1  5000   6500  1.300
    rent, month      1 90000 150000  1.667

== Weights: what your month is really made of
           item  weight
    rent, month    79.6
       meat, kg     5.7
internet, month     4.4
    milk, litre     3.4
  transit, ride     2.8
      eggs, ten     2.5
    bread, loaf     1.6

== Three answers to one question
  the whole basket: 1.698 → 69.8 %
  simple mean over items: 1.846 → 84.6 %
  official index: 1.651 → 65.1 %

== Who raised your basket
           item  weight  times  contribution
    rent, month   0.796  1.667         0.531
       meat, kg   0.057  2.000         0.057
      eggs, ten   0.025  2.857         0.046
    milk, litre   0.034  1.846         0.029
    bread, loaf   0.016  2.000         0.016
internet, month   0.044  1.300         0.013
  transit, ride   0.028  1.250         0.007
  contributions add up to: 0.698 — the basket growth

== Spending per month
  then: 113100 tenge
  today: 192100 tenge
  difference: 79000 tenge a month
The walk-through
A basket is not a list of prices but a list of spending
The price of a loaf says nothing about your month. What says something is price × count: a loaf at 90 tenge taken twenty times a month is 1800 tenge, and the rent paid once a month is 90 000. In the basket they stand side by side, and the second one is fifty times heavier than the first.
So the first thing to do with receipts is to turn them from price tags into cost.
A weight is the item’s share of the base-year spending
weight = the item's cost ÷ the cost of the whole basket. The weights add up to one, and they are a full answer to the question of whose basket this is:
rent, month 79.6
meat, kg 5.7
internet, month 4.4
Eighty per cent of this month is rent. Which means this person’s inflation, whatever happens to eggs, is almost entirely the growth of their rent.
The basket index: what it costs today against what it cost then
the whole basket: 1.698 → 69.8 %
One division: the sum of count × today's price over the sum of count × the price back then. The counts are taken from the base year — the same ones as in the denominator. This is called the Laspeyres index, and official statistics counts in much the same way: it fixes a basket and looks at what it costs now.
Why the simple mean lies
simple mean over items: 1.846 → 84.6 %
It treats eggs and rent as equally important. Eggs went up 2.86 times and take 2.5 % of the weight — their contribution is about nine cents per unit of rent’s contribution (0.046 ÷ 0.531). In a simple mean they pull equally hard, and that is why the answer comes out fifteen points above the truth.
The rule: never average over items. Average over money.
Contribution: who exactly raised the basket
contribution = weight × (times it grew − 1). The contributions add up to exactly the growth of the basket — it is right there in the output: 0.698 in both places.
rent, month 0.796  1.667  0.531
eggs, ten 0.025  2.857  0.046
Rent grew more slowly than eggs and raised the basket twelve times harder. That is where the decomposition earns its keep: it names the item that is worth doing something about.
Why your index differs from the official one
In this teaching example the difference comes from different weights. In real data, items, shops, regions, discounts, quality and observed prices may differ as well: the official basket is the structure of spending averaged over the country, with its shares for food, housing, transport, communications and everything else. It is published, and it is worth reading once — the Bureau of National Statistics explains what the CPI is assembled from.
The gap in the example is 4.8 percentage points, and it is explained entirely by the weights: rented housing takes four times more room in this basket than in the official one.
Two honest sentences follow from this: “inflation in the country is 65 %” and “my inflation is 70 %”. Both are true, and both are meaningless without “whose basket”.
What this count cannot do
A product left the shelves, a new one arrived, the quality changed, you moved to another district — a fixed basket has no room for any of that. Official statistics handles it with substitutions and revisions of the weights; how exactly — in the lesson about reading official statistics, which is still ahead.
The lesson map
Say it in your own words
Answer out loud or on paper without looking. The answers are at the end of the lesson.
- Why can your own inflation not be counted as the mean of the price growth of the items on your receipt?
- What is an item’s weight and where does it come from?
- If the prices in the shop are the same for everyone, why does your index differ from the official one?
Warm-up
Three short steps before the task: predict, fill in, fix. The answers are at the end of the lesson, but answer for yourself first.
1. Predict. What does this program print?
import pandas as pd

two = pd.DataFrame(
    [("matches", 100, 30, 90), ("rent", 1, 90000, 99000)],
    columns=["item", "count", "was", "now"],
)
two["then"] = two["count"] * two["was"]
two["today"] = two["count"] * two["now"]
print("simple mean:", round((two["now"] / two["was"]).mean(), 3))
print("by the basket:", round(two["today"].sum() / two["then"].sum(), 3))
2. Fill in the blank. In place of ... count the weights: each item’s share of the spending.
# three lines of monthly spending, in tenge
import pandas as pd

cost = pd.Series([1800, 3900, 90000], index=["bread", "milk", "rent"])
weights = ...
print((weights * 100).round(1).to_dict())
3. Fix it. The program counts “your inflation” over price tags and forgets the counts.
# bread is bought twenty times a month, rent once
import pandas as pd

basket = pd.DataFrame(
    [("bread", 20, 90, 180), ("rent", 1, 90000, 150000)],
    columns=["item", "count", "was", "now"],
)
print("your inflation:", round(((basket["now"] / basket["was"]).mean() - 1) * 100, 1), "%")
The task
Required. From a table of receipts, count the weights, the index of your own basket and the contribution of every item. Print the items by contribution, largest first, the result next to the official multiplier for the same years, and the difference in points. Separately: name the item that explains most of the growth — its weight and its share of all the growth. And at the end a check: the contributions must add up to the growth of the basket.
The expected output:
== Contribution to growth, largest first
           item  weight  times  contribution
    rent, month   0.796  1.667         0.531
       meat, kg   0.057  2.000         0.057
      eggs, ten   0.025  2.857         0.046
    milk, litre   0.034  1.846         0.029
    bread, loaf   0.016  2.000         0.016
internet, month   0.044  1.300         0.013
  transit, ride   0.028  1.250         0.007

== Result
  my basket: 1.698 → 69.8 %
  official index: 1.651 → 65.1 %
  difference: 4.8 percentage points

== One item explains
  item: rent, month
  its weight: 79.6 % of the basket
  its share: 75.9 % of all growth

== Check
  contributions add up to: 0.6985
  basket growth: 0.6985
  matches: True
Done means: the output matches line for line; the weights are counted from cost rather than from prices; the index is one division of two sums rather than an average over rows; the check matches exactly rather than roughly.
On your own data. For a Laspeyres index, use base-period quantities and the prices of the same items then and now. If only today’s quantities are available, label the result as the cost of today’s basket at old and current prices (a Paasche index), not Laspeyres. Count your index and compare it with the official one for the same period. Then look at the decomposition by contribution: one or two items almost certainly explain more than half of the growth. Those are the first items to investigate, but the remaining costs are real too and are not “noise”.
If you want more.
- Count the index with the counts of today’s year instead of the base year (that is the Paasche index) and compare it with Laspeyres.
- Remove the rent from the basket and see how both the weights and the result change: that is the answer to “what if the flat were mine”.
- Group the items — food, housing, transport, communications — and count the contribution of each group instead of each item.
Where this goes in the project
There is no step: the digest reads official series by country, and the basket is your own personal file, with nothing to do in a shared digest.
But one idea from this lesson already works in the project. The digest’s index (the eighteenth step) is built on official rates, that is, on somebody else’s weights — and that is worth remembering when the digest says “prices grew 1.6 times”. It is talking about the country’s average basket, not about the reader’s.
The debt the course declares here: the digest has neither monthly data nor weights by group. With them would come the question of which group raised the index — the same decomposition by contribution, only at the level of a country. That comes in the lesson about reading official statistics.
The answers
To the questions
- Because a mean over items treats every item as equally important, and they are not: eggs take 2.5 % of the spending, rent takes 79.6 %. In the example the simple mean gives 84.6 % instead of the real 69.8 %.
- A weight is the share of the base-year spending: the item’s cost divided by the cost of the whole basket. It comes from
price × countrather than from the price — that is, from how much money goes to that item. - Because the weights differ, not the prices. The official basket is the structure of spending averaged over the country; yours may have rent at eighty per cent where the average has considerably less. The same price tags spread over different weights give a different index.
To the warm-up
- Matches went up three times, rent by a tenth. The simple mean takes half of each; the basket goes by money, and in the money the weight of matches is next to nothing.
simple mean: 2.05
by the basket: 1.161
cost / cost.sum(). Weights are shares, they add up to one, and they are counted from cost.
import pandas as pd

cost = pd.Series([1800, 3900, 90000], index=["bread", "milk", "rent"])
weights = cost / cost.sum()
print((weights * 100).round(1).to_dict())
{'bread': 1.9, 'milk': 4.1, 'rent': 94.0}
- It has to count by cost: multiply the prices by the counts and divide the sums.
import pandas as pd

basket = pd.DataFrame(
    [("bread", 20, 90, 180), ("rent", 1, 90000, 150000)],
    columns=["item", "count", "was", "now"],
)
then = basket["count"] * basket["was"]
now = basket["count"] * basket["now"]
print("your inflation:", round((now.sum() / then.sum() - 1) * 100, 1), "%")
your inflation: 67.3 %
To the task
The decomposition by contribution rests on the contributions adding up to the growth of the basket. That is not a coincidence: Σ weight × (growth − 1) is (Σ today ÷ Σ then) − 1 itself, only written out item by item. That is why the check at the end of the task matches exactly rather than roughly, and why any gap means an error in the weights.
The comparison with the official index gives a difference of 4.8 points. What is useful is not the number itself but that it can be explained: in this basket rent takes 79.6 % of the weight, and the whole argument with the official figure is about the share of housing rather than about the price of bread.
Sources
- Consumer price index, World Bank — the official index the basket is compared against.
- Price indices, Bureau of National Statistics of Kazakhstan — the structure of the official basket and how it is revised.
- Laspeyres and Paasche indices, ILO consumer price index manual — where the formulas come from and how they differ.
If you have found a mistake or a typo in this article, tell us about it
Comments (0)
Log in to leave a comment →
No comments yet. Be the first.