

Python: from data to your own digest Lesson 43 of 56
What comes from outside and what is ours: one shock, many prices
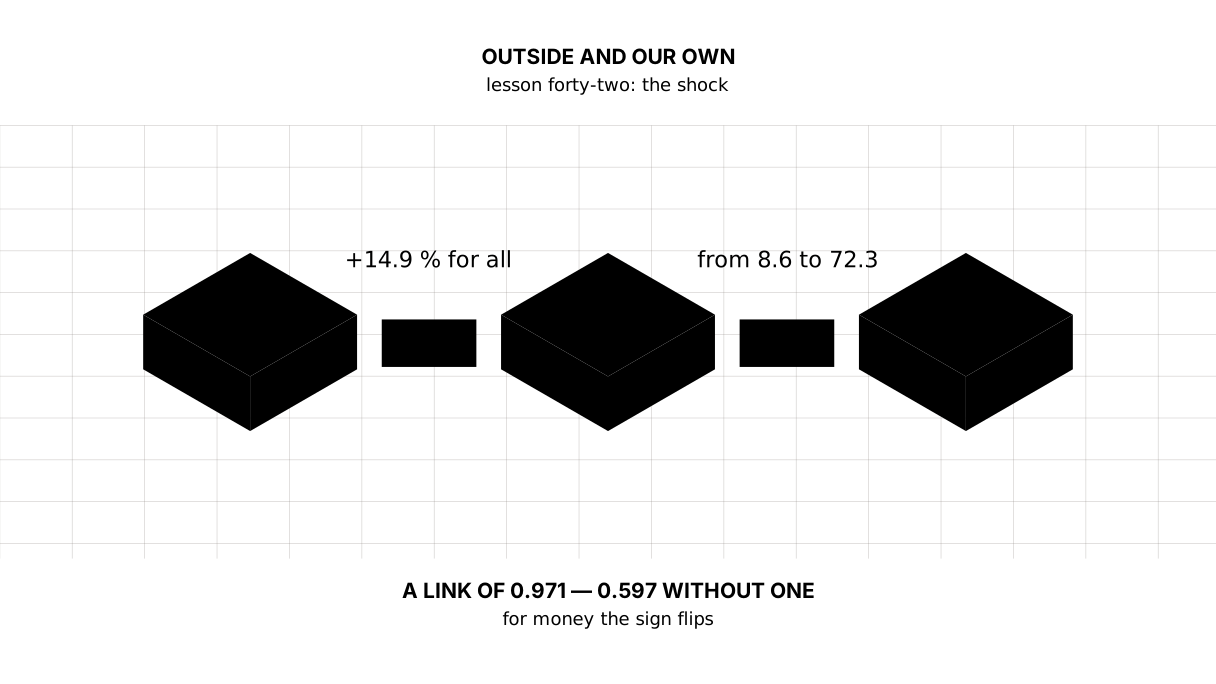
The forty-second lesson of the Python course. In 2022 world food rose by 14.9 % — the same for everybody. Inflation among ten neighbours came out between 8.6 and 72.3 %, a difference of eight times. The two usual culprits, the rate and money, are tested with a link — and one country moves the answer, while for money it flips the sign.
Why this matters
When prices rise, the explanation arrives in a second and is always one of two: “the world is to blame” or “we are”. Both sentences can be checked, and the check costs one evening.
The world in 2022 was the same for everyone: the index of world food prices rose by 14.9 % — not “roughly”, but literally one number for every country at once. Inflation, meanwhile, spread out eightfold. So a single external shock does not settle the matter, and what has to be looked at is how the countries differed.
Along the way the lesson introduces the measure the course will need next: the link between two columns, and the question of how many observations stand behind it.
The whole thing first
The file is shok.py. World prices come from the FAO index, 2014–2016 = 100. Inflation, the exchange rate and broad money come from the World Bank for 2022.
"""Lesson 42: what comes from outside and what is ours -- one shock, many prices.

Every number is real. World food prices come from the FAO index, 2014-2016 =
100. Inflation, the exchange rate against the dollar and broad money come from
the World Bank for 2022: FP.CPI.TOTL.ZG, PA.NUS.FCRF and FM.LBL.BMNY.CN.
"""

import pandas as pd

# World food prices: one and the same series for every country at once.
FAO = pd.Series({2019: 94.93, 2020: 98.05, 2021: 125.73, 2022: 144.51, 2023: 124.52})

# Ten neighbours in the year of the shock: inflation, the change in the rate
# against the dollar and the growth of broad money, all in per cent for 2022.
# A gap is a gap: for two of them the World Bank publishes no broad money.
NEIGHBOURS = pd.DataFrame(
    [
        ("Armenia", 8.64, -13.52, 16.10),
        ("Uzbekistan", 11.45, 4.15, 30.17),
        ("Georgia", 11.90, -9.48, 11.04),
        ("Russia", 13.74, -7.02, None),
        ("Azerbaijan", 13.85, 0.00, 23.60),
        ("Kyrgyzstan", 13.92, -0.62, 30.59),
        ("Kazakhstan", 15.03, 8.04, 13.94),
        ("Belarus", 15.21, 3.44, None),
        ("Moldova", 28.74, 6.88, 5.27),
        ("Turkiye", 72.31, 86.98, 60.34),
    ],
    columns=["country", "inflation", "rate", "money"],
).set_index("country")

print("== One shock for everybody")
world = FAO.pct_change().mul(100).round(1)
print(pd.DataFrame({"FAO index": FAO, "a year, %": world}).to_string())
print(f"  in 2022 world food rose by {world[2022]} % — the same for all ten")

print()
print("== Ten neighbours, one year")
print(NEIGHBOURS["inflation"].sort_values().to_string())
low, high = NEIGHBOURS["inflation"].min(), NEIGHBOURS["inflation"].max()
print(f"  from {low} to {high} — a difference of {round(high / low, 1)} times")
print("  the median:", round(NEIGHBOURS["inflation"].median(), 2))

print()
print("== The two explanations usually offered")
for column, name in (("rate", "its own exchange rate"), ("money", "its own broad money")):
    pair = NEIGHBOURS[["inflation", column]].dropna()
    print(f"  {name:22} link {NEIGHBOURS['inflation'].corr(NEIGHBOURS[column]):+.3f}"
          f"   countries counted: {len(pair)}")

print()
print("== What one country does to those links")
without = NEIGHBOURS.drop("Turkiye")
print(f"  {'':22} {'all ten':>12} {'no Turkiye':>12}")
for column in ("rate", "money"):
    a = NEIGHBOURS["inflation"].corr(NEIGHBOURS[column])
    b = without["inflation"].corr(without[column])
    print(f"  {column:22} {a:>12.3f} {b:>12.3f}")

print()
print("== The ones neither of them explains")
miss = NEIGHBOURS.loc[["Moldova", "Kyrgyzstan"]]
print(miss.to_string())
print("  Moldova: prices +28.7 % with the rate at +6.9 % and money at +5.3 %")
print("  Kyrgyzstan: money +30.6 %, and prices grew like the neighbours at +14 %")
The output:
== One shock for everybody
      FAO index  a year, %
2019      94.93        NaN
2020      98.05        3.3
2021     125.73       28.2
2022     144.51       14.9
2023     124.52      -13.8
  in 2022 world food rose by 14.9 % — the same for all ten

== Ten neighbours, one year
country
Armenia        8.64
Uzbekistan    11.45
Georgia       11.90
Russia        13.74
Azerbaijan    13.85
Kyrgyzstan    13.92
Kazakhstan    15.03
Belarus       15.21
Moldova       28.74
Turkiye       72.31
  from 8.64 to 72.31 — a difference of 8.4 times
  the median: 13.88

== The two explanations usually offered
  its own exchange rate  link +0.971   countries counted: 10
  its own broad money    link +0.739   countries counted: 8

== What one country does to those links
                              all ten   no Turkiye
  rate                          0.971        0.597
  money                         0.739       -0.538

== The ones neither of them explains
            inflation  rate  money
country
Moldova         28.74  6.88   5.27
Kyrgyzstan      13.92 -0.62  30.59
  Moldova: prices +28.7 % with the rate at +6.9 % and money at +5.3 %
  Kyrgyzstan: money +30.6 %, and prices grew like the neighbours at +14 %
The walk-through
One shock really is one
2021     125.73       28.2
2022     144.51       14.9
The FAO index is world food prices: wheat, oil, sugar, dairy, meat. It is not about a country, it is about the world, and in 2022 it is the same for Armenia and for Türkiye.
That makes the sentence “prices went up because of world prices” checkable. A common external shock can affect every country, but its strength depends on import exposure, exchange rates, the consumption basket and domestic pass-through. Inflation spread from 8.64 to 72.31 — 8.4 times — so the common factor alone cannot explain the differences.
The link: one number instead of ten comparisons
Series.corr computes Pearson’s correlation coefficient. +1 is a perfect positive linear relationship, −1 a perfect negative linear relationship, and 0 means no linear relationship; a nonlinear relationship may still exist. Here it compares differences among countries in one year, not movement of two series through time. It does not mean “how many times” or “by how many per cent”.
  its own exchange rate  link +0.971   countries counted: 10
  its own broad money    link +0.739   countries counted: 8
The first number looks like a law of nature. The second looks like weak support. And beside them stands the thing without which neither means anything: how many countries they rest on. Broad money has eight, not ten: for Russia and Belarus the World Bank does not publish it for these years, and pandas dropped those two pairs without a word. The number of observations is always printed beside a link.
One country decides the answer
  rate                          0.971        0.597
  money                         0.739       -0.538
Take out Türkiye — one row out of ten — and the law of nature turns into a hint, while the link with money changes sign: it was positive and is now negative. That is, on nine countries the data says “where money grew more, prices grew more slowly”, which as a statement about the world is absurd — and the right conclusion here is not “money does not matter” but “a question like this is not settled on ten points”.
This is the same story as the mean in lesson thirty-seven: there one value rewrote the mean, here one value rewrites the link. The difference is that a link looks more convincing — it has no units, and it is easy to mistake for a conclusion.
The ones neither of them explains
Moldova         28.74  6.88   5.27
Kyrgyzstan      13.92 -0.62  30.59
Moldova’s row shows inflation of 28.7 % alongside broad-money growth of 5.3 % and an exchange-rate change of 6.9 %. Other factors, such as an energy-price shock, may be involved, but this table cannot identify the cause. Kyrgyzstan shows the reverse pattern: broad money grew 30.6 %, while inflation stayed near the level of its neighbours.
A pair of rows like that is the best test of an explanation. If the cause has been named correctly, it has to work on them too.
Why “the exchange rate is to blame” cannot be said
A link of +0.971 is no proof of direction. A devaluation raises the price of imports, but high inflation also drags the rate down, and both may come from a third cause that is not in the table at all. The link says only: “these two columns moved together”. Which moved which does not follow from it, and no size of link will change that.
The working rule: a link is a reason to look for a mechanism, not a substitute for one.
How many points are needed
There is no direct answer, but there is a check more honest than any rule: count the link without each country in turn. If one row moves the answer by a third and another flips its sign, there are too few points — whether there are ten of them or a hundred. That check is what the task is.
The lesson map
Say it in your own words
Answer out loud or on paper without looking. The answers are at the end of the lesson.
- Why does a world shock that is the same for everyone not explain a difference of eight times?
- What does a link of +0.971 mean, and what does it not mean?
- Why print the number of observations beside a link?
Warm-up
Three short steps before the task: predict, fill in, fix. The answers are at the end of the lesson, but answer for yourself first.
1. Predict. What does the program print, and why is the second number almost one?
import pandas as pd

a = pd.Series([1, 2, 3, 4])
b = pd.Series([4, 3, 2, 1])
print("link:", round(a.corr(b), 3))
a_plus = pd.Series([1, 2, 3, 4, 100])
b_plus = pd.Series([4, 3, 2, 1, 100])
print("and with one big pair:", round(a_plus.corr(b_plus), 3))
2. Fill in the blank. In place of ... count how many countries actually take part in the link.
# every country has inflation, not every one has broad money
import pandas as pd

table = pd.DataFrame(
    {"inflation": [8.64, 11.45, 13.74, 15.21], "money": [16.10, 30.17, None, None]},
    index=["Armenia", "Uzbekistan", "Russia", "Belarus"],
)
pair = ...
print("countries counted:", len(pair))
3. Fix it. The program prints a link and claims it was counted over four countries.
# two countries have no broad money, and pandas drops those pairs in silence
import pandas as pd

table = pd.DataFrame(
    {"inflation": [8.64, 11.45, 13.74, 15.21], "money": [16.10, 30.17, None, None]},
    index=["Armenia", "Uzbekistan", "Russia", "Belarus"],
)
print("link:", round(table["inflation"].corr(table["money"]), 3), "over", len(table), "countries")
The task
Required. From the table of ten neighbours, count the link of inflation with the exchange rate and with broad money, printing the number of countries beside each. Then recount both links taking out one country at a time and print a table: the link without that country and the shift from the full one. Sort by the size of the shift. At the end name the country that moves the answer most, and separately the ones that make a link change sign.
The expected output:
== The link and how many countries stand behind it
  rate     +0.971  over 10 countries
  money    +0.739  over 8 countries

== Taking out one country at a time
             rate  money  rate, shift  money, shift
Turkiye     0.597 -0.538       -0.374        -1.277
Moldova     0.985  0.891        0.014         0.152
Uzbekistan  0.978  0.793        0.007         0.054
Kazakhstan  0.977  0.735        0.006        -0.004
Georgia     0.972  0.728        0.001        -0.011
Russia      0.972  0.739        0.001         0.000
Belarus     0.972  0.739        0.001         0.000
Armenia     0.971  0.728        0.000        -0.011
Azerbaijan  0.971  0.747        0.000         0.008
Kyrgyzstan  0.971  0.782        0.000         0.043

== Who decides the answer
  rate     without Turkiye the link goes from +0.971 to +0.597
  money    without Turkiye the link goes from +0.739 to -0.538

== The check
  rate     countries that flip the sign: none
  money    countries that flip the sign: Turkiye
Done means: the output matches line for line; the number of countries is printed beside every link rather than once at the bottom; “who decides the answer” is found by the size of the shift rather than by eye; the change of sign is checked by comparing signs rather than by looking; the sort is stable — several countries share a shift, and an ordinary sort puts them in a different order on a different machine.
On your own data. Take any two columns you believe are related: spending and the weather, visits and the day of the week, sales and the exchange rate. Count the link, then count it without each point in turn — and see how many points have to go before the answer changes. That is the measure of how far you can lean on it.
If you want more.
- Count the link of inflation with the rate on logarithms (
numpy.log1p) and see how much less Türkiye moves it. - Add an eleventh country with average values and check that the link barely changes: robustness is tested by adding as well as by removing.
- Compare the default
corr()(Pearson) withcorr(method="spearman")— the second counts on ranks, and an outlier moves it less.
Where this goes in the project
Step twenty-one, and it is about what the digest will not do.
The digest follows three countries. The question “did prices and money move together” always produces a number on three countries — and that number is worth nothing, which is what the lesson has just shown on ten. So esep.baylanys is given a floor: it counts the countries that have both numbers, compares that with the floor, and returns either the link together with the count or a refusal and what it would take.
On the live data the answer is a refusal, and a doubly deserved one: аз: 2 ел, 8 керек — the World Bank publishes no broad money for Russia, so two of the three countries remain. The refusal is printed on the page as a line of its own: a line that disappears when the data is thin teaches the reader that the line was optional.
The floor is the one number in esep.py chosen rather than measured: eight is small enough for a regional digest to reach and large enough that no single country decides the sign.
The answers
To the questions
- Because the shock is the same for everyone while the result spread 8.4 times. One and the same cause cannot explain different results — so something else is at work, and that something is each country’s own.
- That the two columns moved together: where the rate fell further, prices rose further. It does not mean the rate is the cause, does not mean “by so many per cent”, and does not carry over to a country that is not in the table.
- Because pandas drops the pairs with a gap in silence: the same +0.739 was counted over eight countries, not ten. A link without the number of observations is half a statement, and usually the prettier half.
To the warm-up
- Four points lie on a perfect falling line, so the link is exactly −1. One pair of two big numbers adds a common movement upward, and the same four become an almost perfect line, only a rising one.
link: -1.0
and with one big pair: 0.999
table[["inflation", "money"]].dropna(). What has to be counted is pairs, not rows: a country with no broad money does not enter the link.
# every country has inflation, not every one has broad money
import pandas as pd

table = pd.DataFrame(
    {"inflation": [8.64, 11.45, 13.74, 15.21], "money": [16.10, 30.17, None, None]},
    index=["Armenia", "Uzbekistan", "Russia", "Belarus"],
)
pair = table[["inflation", "money"]].dropna()
print("countries counted:", len(pair))
countries counted: 2
- The link itself pandas counts correctly — over two pairs. What was untrue is the sentence around it: “over four countries”.
# the same table: a link is printed together with the countries behind it
import pandas as pd

table = pd.DataFrame(
    {"inflation": [8.64, 11.45, 13.74, 15.21], "money": [16.10, 30.17, None, None]},
    index=["Armenia", "Uzbekistan", "Russia", "Belarus"],
)
pair = table[["inflation", "money"]].dropna()
print("link:", round(pair["inflation"].corr(pair["money"]), 3), "over", len(pair), "countries")
link: 1.0 over 2 countries
And the thing this warm-up was written for: a link over two points is always one. Exactly one straight line passes through two points, so the one here is not a result but a warning.
To the task
The shifts line up as a staircase: Türkiye moves the link with the rate by 0.374 and the one with money by 1.277, while Moldova, the next in line, moves them by 0.014 and 0.152. A hundredfold gap. When one observation breaks that far away from the rest, the answer belongs to it rather than to the data.
Checking the sign matters more than the size. A link that turns from positive to negative when one row is removed is not “weak” — it is undefined on this data, and the only honest conclusion from it is that more countries are needed, or a different question.
Sources
- FAO Food Price Index — world food prices, by month and by year, 2014–2016 = 100.
- Inflation, consumer prices, World Bank — the inflation of ten neighbours in 2022.
- Official exchange rate, World Bank — the rate against the dollar the devaluation is counted from.
- Series.corr — how pandas counts a link and what it does with gaps.
If you have found a mistake or a typo in this article, tell us about it
Comments (0)
Log in to leave a comment →
No comments yet. Be the first.