

Python: from data to your own digest Lesson 41 of 56
Where money comes from: cash, deposits, credit
The fortieth lesson of the Python course. Of all the money in the country the National Bank printed nine per cent; the other ninety-one are records in bank accounts that appeared at the moment a bank made a loan. The aggregates as a matryoshka, money per tenge of GDP, the money multiplier — and what the law says about all of it.
Why this matters
“The state prints the money” is a sentence that is easy to check, and the check gives an unexpected answer: it prints nine per cent of it. The rest of the money in the country is records in accounts, and they did not come from a printing house.
This lesson is about counting those records, about where they come from, and about where the line runs between what the National Bank does and what the banks do. It is also the first lesson of the course with the text of a law standing next to the numbers: money has definitions as well as figures, and the definitions are written in words.
The whole thing first
The file is aqsha.py. The aggregates come from the National Bank of Kazakhstan, the table “Monetary base and broad money aggregates”, end of year, in millions of tenge. GDP, the price index and credit to the private sector come from the World Bank.
"""Lesson 40: where money comes from -- cash, deposits, credit.

The numbers are real. The aggregates come from the National Bank of Kazakhstan,
the table "Monetary base and broad money aggregates", end of year, in millions
of tenge. GDP, the price index and credit to the private sector come from the
World Bank.
"""

import pandas as pd

# End of year, millions of tenge: cash, M1, M2, M3 and the monetary base.
MONEY = pd.DataFrame(
    [
        (2019, 2_300_505, 5_928_085, 16_054_341, 21_322_070, 6_893_176),
        (2025, 4_749_199, 11_935_072, 45_805_638, 52_751_740, 15_678_721),
    ],
    columns=["year", "M0", "M1", "M2", "M3", "base"],
).set_index("year")

GDP = pd.Series({2019: 69_532_626.5, 2025: 159_561_346.6})   # GDP, millions of tenge
PRICES = pd.Series({2019: 189.30, 2025: 348.12})             # price index, 2010 = 100
CREDIT = pd.Series({2019: 21.20, 2025: 25.88})               # credit to the private sector, % of GDP

# What each layer of the matryoshka actually adds.
LAYERS = {
    "M0": "cash outside the banks",
    "M1": "transferable deposits in tenge",
    "M2": "term deposits and transferable ones in currency",
    "M3": "the remaining deposits in foreign currency",
}

print("== The matryoshka: what each layer adds, 2025")
names = ["M0", "M1", "M2", "M3"]
sums = MONEY.loc[2025, names]
layers = pd.DataFrame({
    "aggregate": names,
    "total": sums.values,
    "layer": sums.diff().fillna(sums).astype(int).values,
    "what is in it": [LAYERS[n] for n in names],
})
layers["share"] = (layers["layer"] / sums["M3"] * 100).round(1)
print(layers.to_string(index=False))

print()
print("== What money is made of")
for year in (2019, 2025):
    cash = MONEY.loc[year, "M0"] / MONEY.loc[year, "M3"] * 100
    print(f"  {year}: cash {cash:.1f} %, records in banks {100 - cash:.1f} %")

print()
print("== How much money per tenge of GDP")
for year in (2019, 2025):
    share = MONEY.loc[year, "M3"] / GDP[year]
    print(f"  {year}: {share:.3f} tenge of money per tenge of GDP, "
          f"turning over {1 / share:.2f} times a year")

print()
print("== Who made it")
for year in (2019, 2025):
    mult = MONEY.loc[year, "M3"] / MONEY.loc[year, "base"]
    print(f"  {year}: base {MONEY.loc[year, 'base']:>12,} → M3 {MONEY.loc[year, 'M3']:>12,}"
          f", multiplier {mult:.3f}".replace(",", " "))
print("  credit to the private sector, % of GDP:",
      f"{CREDIT[2019]:.1f} → {CREDIT[2025]:.1f}")

print()
print("== What grew over six years, times")
growth = pd.Series({
    "prices": PRICES[2025] / PRICES[2019],
    "GDP at current prices": GDP[2025] / GDP[2019],
    "cash": MONEY.loc[2025, "M0"] / MONEY.loc[2019, "M0"],
    "money M3": MONEY.loc[2025, "M3"] / MONEY.loc[2019, "M3"],
})
print(growth.round(3).to_string())

print()
print("== Monetisation: broad money, % of GDP, 2024")
world = pd.Series({
    "Uzbekistan": 18.04,
    "Kazakhstan": 33.40,
    "Turkey": 43.47,
    "Georgia": 53.18,
    "United States": 98.76,
    "China": 227.67,
})
print(world.to_string())
The output:
== The matryoshka: what each layer adds, 2025
aggregate    total    layer                                   what is in it  share
       M0  4749199  4749199                          cash outside the banks    9.0
       M1 11935072  7185873                  transferable deposits in tenge   13.6
       M2 45805638 33870566 term deposits and transferable ones in currency   64.2
       M3 52751740  6946102      the remaining deposits in foreign currency   13.2

== What money is made of
  2019: cash 10.8 %, records in banks 89.2 %
  2025: cash 9.0 %, records in banks 91.0 %

== How much money per tenge of GDP
  2019: 0.307 tenge of money per tenge of GDP, turning over 3.26 times a year
  2025: 0.331 tenge of money per tenge of GDP, turning over 3.02 times a year

== Who made it
  2019: base    6 893 176 → M3   21 322 070  multiplier 3.093
  2025: base   15 678 721 → M3   52 751 740  multiplier 3.365
  credit to the private sector, % of GDP: 21.2 → 25.9

== What grew over six years, times
prices                   1.839
GDP at current prices    2.295
cash                     2.064
money M3                 2.474

== Monetisation: broad money, % of GDP, 2024
Uzbekistan        18.04
Kazakhstan        33.40
Turkey            43.47
Georgia           53.18
United States     98.76
China            227.67
The walk-through
The aggregates are a matryoshka, not a sum
M0, M1, M2 and M3 are not four piles of money to be added up. Each one contains the previous and adds a layer of its own:
- M0 — cash outside the banks;
- M1 — plus transferable deposits in tenge: the money paid straight from an account;
- M2 — plus term deposits in tenge and transferable ones in foreign currency;
- M3 — plus the remaining deposits in foreign currency. This is “broad money”, the number that gets called the money of a country.
Adding them up is the standard mistake: it gives 115 trillion tenge where the money is 52.75 trillion. That is why the program counts a layer as a difference instead of taking it from a line of its own.
M0 is nine per cent of broad money
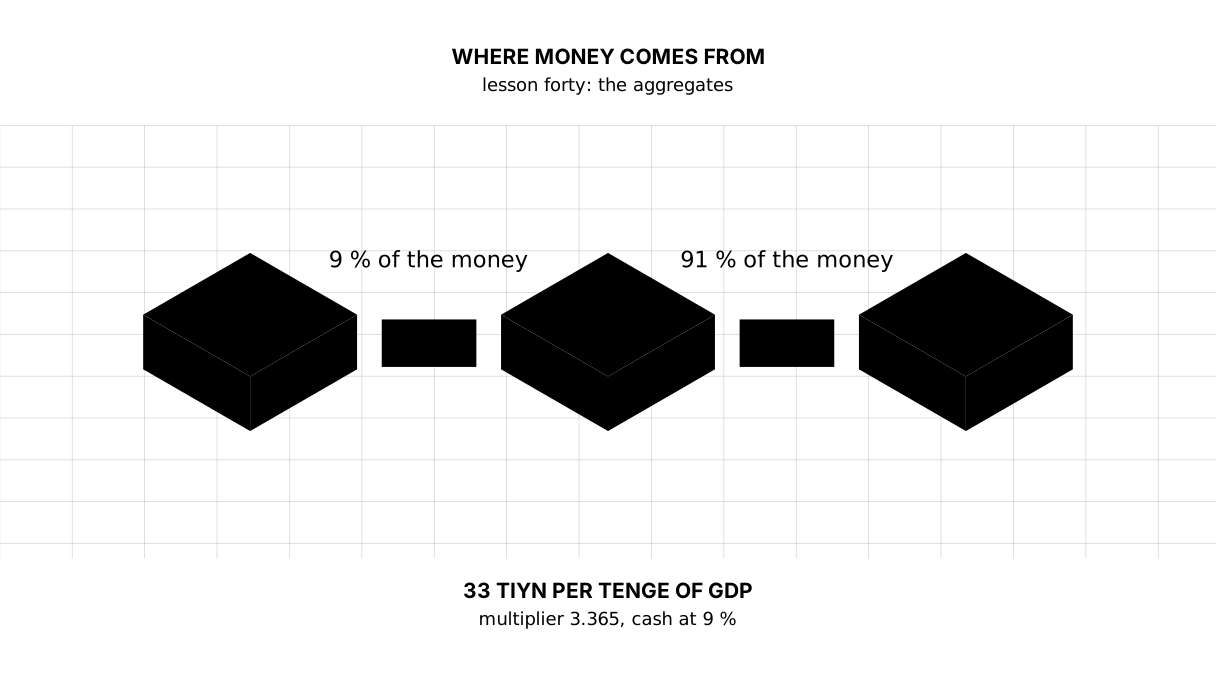
2025: cash 9.0 %, records in banks 91.0 %
M0 is cash outside deposit-taking institutions; in 2025 it is 9% of M3. The other 91% consists of bank deposits. Much deposit money is created through bank lending, but repayments, transfers, asset purchases, fiscal, external and central-bank operations also change the aggregates. Six years ago its share was 10.8 %, and it is drifting down: people pay with a card rather than a note.
The National Bank’s table has a similar number standing next to it, and it is a different one: cash outside the National Bank is 5 271 109 million against the 4 749 199 of M0. The difference, 521 910 million, sits in the tills of the banks. It is not part of the country’s money: a note in a bank’s till is not yet in anybody’s hands, so M0 does not count it.
A deposit is a bank’s obligation
The money on your card is not notes lying somewhere with your name on them. It is a record: the bank owes you that much. The law says so directly, in article 756 of the Civil Code: under a bank deposit contract the bank undertakes to accept the money and “to return the deposit”.
The split of the aggregates follows from that. Article 757 lists the kinds of deposit — on demand, term, savings, conditional — and the first of them is M1 while the rest are added in M2 and M3. The matryoshka of aggregates repeats what the code already says: different promises by a bank come back at different speeds.
Credit creates the deposit
When a bank lends, it records a loan asset and usually credits a deposit liability. In a simplified balance sheet both initially grow by the loan amount. Transfers, repayments and other operations then affect monetary aggregates, so M3 need not change by exactly the amount of one loan.
This is not a fringe theory but the way central banks describe their own system; the shortest and clearest account of it is the Bank of England’s Money creation in the modern economy.
That is why credit to the private sector stands next to it in the program: 21.2 % of GDP in 2019 and 25.9 % in 2025. When lending grows, so does the money supply — it is the same record counted from two sides.
Money per tenge of GDP
2025: 0.331 tenge of money per tenge of GDP, turning over 3.02 times a year
For every tenge of a year’s output there are 33 tiyn of money in the country. The tiyn, incidentally, exists in the law — “the tenge consists of 100 tiyn” — and while you will not find one in a wallet, it is alive in the arithmetic.
Here annual nominal GDP divided by year-end M3 is only a rough turnover proxy. Velocity is normally nominal GDP divided by the average money stock over the same period; a single year-end observation can distort it. The ratio is neither “little” nor “much” on its own: in 2024 broad money was 18 % of GDP in Uzbekistan, 33 % in Kazakhstan, 99 % in the United States and 228 % in China. These figures describe financial structure and cannot by themselves measure wealth or how long money remains in accounts.
The monetary base and the multiplier
The monetary base is what the National Bank made itself: cash plus the banks’ accounts at the National Bank. M3 is 3.365 times larger than the base. The multiplier is not a mechanism but a result: it shows how much larger the system of obligations built on top of the National Bank’s money turned out to be than that money itself.
A good way to test yourself here is the question “who owes whom”. A banknote is an obligation of the National Bank — article 41 of the law says it in as many words: banknotes and coins are its unconditional obligations. A deposit is an obligation of a bank. We call both records money, but the debtors are different, and in a crisis that difference becomes the main thing about them.
What the law says
The law “On the National Bank of the Republic of Kazakhstan” gives the National Bank the issue of money — and only that:
- article 38: the national currency is the tenge, and it consists of 100 tiyn;
- article 39: the tenge is the legal tender;
- article 40: the issue of banknotes and coins, the organisation of their circulation and their withdrawal are carried out “exclusively by the National Bank of Kazakhstan”;
- article 47-2, which appeared in the law in January 2026: the digital tenge is also a form of the national currency, also an unconditional obligation of the National Bank, and also issued by it exclusively.
The word “exclusively” is said about banknotes, coins and the digital tenge. About the other 91 % of the money the law speaks in different words and in a different code — as a contract between you and your bank. That is the whole difference: issuing cash is a state monopoly, while creating deposits is the daily work of supervised banks.
What this count cannot do
It says nothing about whether a country has too much money or too little. “Too much” and “too little” exist only relative to something: an inflation target, the maturity of the banks, the habit of saving in foreign currency. Monetisation compares across countries only with caveats, and “money grew 2.47 times while prices grew 1.84” is an observation rather than a cause: to claim anything about causes takes monthly series and work this course has not done yet.
The lesson map
Say it in your own words
Answer out loud or on paper without looking. The answers are at the end of the lesson.
- Why can the aggregates M0, M1, M2 and M3 not be added together?
- Where does a deposit that did not exist yesterday come from?
- Which money does the law call the National Bank’s exclusive business, and what share of the country’s money falls under that word?
Warm-up
Three short steps before the task: predict, fill in, fix. The answers are at the end of the lesson, but answer for yourself first.
1. Predict. What does this program print, and why is the second number smaller than the first?
import pandas as pd

money = pd.Series({"M0": 4_749_199, "M1": 11_935_072, "M2": 45_805_638, "M3": 52_751_740})
print("the aggregates add up to:", money.sum())
print("the money in the country:", money["M3"])
2. Fill in the blank. In place of ... count the share of cash in broad money, in per cent.
# millions of tenge, the end of 2025
import pandas as pd

nbk = pd.Series({"M0": 4_749_199, "M3": 52_751_740})
cash = ...
print("cash:", round(cash, 1), "%")
3. Fix it. The program counts money per tenge of GDP and prints a zero.
gdp = 159_561_346_600_000
m3 = 52_751_740
print("per tenge of GDP:", round(m3 / gdp, 3))
The task
Required. From the National Bank’s table of aggregates and the World Bank’s series, count for every year: the share of cash in M3, the money per tenge of GDP and the money multiplier. Print the table year by year. Then count how many times prices, GDP and money grew over the period, and which of them grew fastest. And at the end, a check against a second source: the World Bank’s broad money, rounded to a million tenge, must match the National Bank’s M3 in every year.
The expected output:
== Money year by year
            M3  cash  per tenge of GDP  multiplier
year
2019  21322070  10.8             0.307       3.093
2020  24917785  11.3             0.353       2.548
2021  30099291  10.0             0.359       2.747
2022  34295955   9.8             0.331       2.888
2023  38301572   9.5             0.321       3.319
2024  45660003   9.6             0.334       3.126
2025  52751740   9.0             0.331       3.365

== What grew over 2019-2025, times
prices      1.839
GDP         2.295
money M3    2.474
  the fastest: money M3

== Checked against a second source
  the largest gap, millions of tenge: 0
  matches in every year: True
Done means: the output matches line for line; the share of cash and the multiplier are counted from the table rather than copied in by hand; the check against the second source prints the largest gap rather than just saying “it matches”.
On your own data. Take the monthly rows of the last two years from the National Bank and look at M0 inside a year: cash grows towards December and falls in January. Count by how many per cent, and think about what kind of money that is. A second pass: build the same count for a neighbouring country from the World Bank series (FM.LBL.BMNY.GD.ZS and NY.GDP.MKTP.CN) and compare the monetisation.
If you want more.
- Count how much of the growth of M3 over six years came from tenge deposits and how much from deposits in foreign currency.
- Compare the growth of the monetary base with the growth of M3: the multiplier went from 3.093 to 3.365 — find the year it fell in and look at what was happening to term deposits then.
- Convert M3 into dollars at the rate at the end of each year and see what the same series looks like in another currency.
Where this goes in the project
Step nineteen. Until now the digest knew one series — inflation. Now it has a second indicator and a fourth table: how much money each of the same three countries has per tenge of GDP.
A second series immediately exposes what one series hid: collect could only take inflation, and the address of the indicator and the name of the file were wired into it. In the new step a series is two arguments rather than a built-in constant, and aqsha.csv appears on disk next to inflation.csv. A third series would now cost a line rather than a copy of the program.
What the digest prints: Kazakhstan — 33 tiyn, Uzbekistan — 20, Russia — белгісіз, unknown. The last one is not a bug: the World Bank has no broad money for Russia in these years. The country’s row stays in the table and says so out loud — a report a country has quietly fallen out of looks complete and is not.
The answers
To the questions
- Because they are nested: M1 contains M0, M2 contains M1, M3 contains M2. A sum would count the cash four times. The money in the country is whatever sits in the largest aggregate — 52.75 trillion tenge at the end of 2025.
- From credit. When a bank lends, it makes two records at once: the sum in your account and your debt to the bank. The deposit appears at the same moment as the debt, and disappears when the debt is repaid.
- Banknotes, coins and the digital tenge — articles 40 and 47-2 of the law on the National Bank. That is 9 % of the country’s money. The other 91 % are deposits, that is, obligations of banks under a deposit contract, article 756 of the Civil Code.
To the warm-up
- The aggregates are nested, so the sum counts the same money several times over. The second number is smaller because it is all the money there is, while the first is arithmetical rubbish.
the aggregates add up to: 115241649
the money in the country: 52751740
nbk["M0"] / nbk["M3"] * 100. A share is a division by the whole, and the whole here is M3.
import pandas as pd

nbk = pd.Series({"M0": 4_749_199, "M3": 52_751_740})
cash = nbk["M0"] / nbk["M3"] * 100
print("cash:", round(cash, 1), "%")
cash: 9.0 %
- The units differ: GDP is in tenge while the National Bank’s aggregates are in millions of tenge. The zero came not from rounding but from dividing a number that had already been made a million times smaller.
# GDP in tenge, the money in millions of tenge
gdp = 159_561_346_600_000
m3 = 52_751_740
print("per tenge of GDP:", round(m3 * 1e6 / gdp, 3))
per tenge of GDP: 0.331
To the task
The check against a second source is the main thing in this task. The National Bank and the World Bank publish the same number independently of each other, and it matches to a million tenge in all seven years. It is worth doing with any series that will later go into a text: two publications agreeing does not prove a figure is right, but a disagreement says at once that something is wrong — in the units, in the year, or in the definition of the indicator.
The multiplier is not monotonic across the years: 3.093 in 2019, 2.548 in 2020, 3.365 in 2025. The dip in 2020 is the base growing faster than the money supply, which is exactly what a year of a central bank adding liquidity looks like.
Sources
- Monetary base and broad money aggregates, National Bank of Kazakhstan — M0, M1, M2, M3 and the monetary base, month by month.
- Broad money, % of GDP, World Bank — monetisation by country, the second source for the check.
- The law “On the National Bank of the Republic of Kazakhstan” — chapter 7: the monetary unit, legal tender, the issue of banknotes and the digital tenge.
- Money creation in the modern economy, Bank of England — how credit creates a deposit, in a central bank’s own words.
If you have found a mistake or a typo in this article, tell us about it
Comments (0)
Log in to leave a comment →
No comments yet. Be the first.