

Python: from data to your own digest Lesson 46 of 56
Classification and the confusion matrix
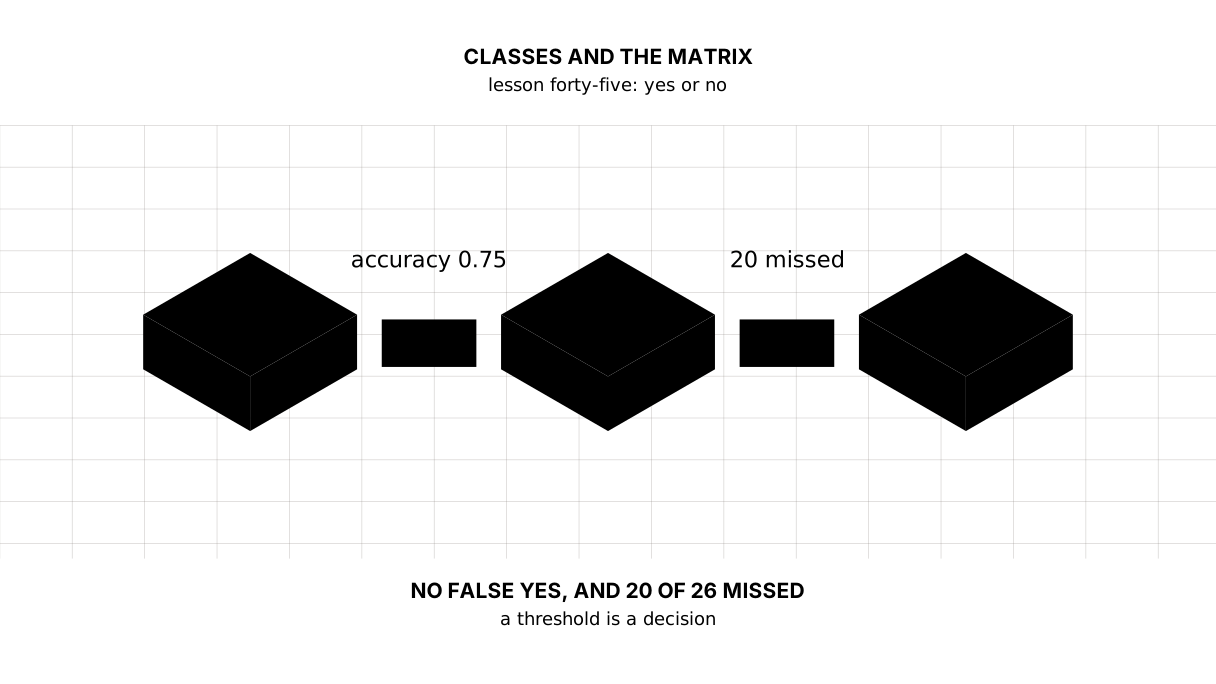
The forty-fifth lesson of the Python course. The model answers yes or no: will next year's inflation be above ten per cent. Accuracy of 0.75 against 0.675 for a model that always says no — and the confusion matrix shows that twenty of the twenty-six high years were missed along the way.
Why this matters
Until now a model answered with a number. Now it answers yes or no — and that is a different kind of mistake: not “off by seven points” but “said the wrong thing”.
There are exactly two kinds of mistake here, and they cost different amounts. A false yes is an alarm raised for nothing. A miss is an alarm not raised when it was needed. A single number like accuracy mixes them together, and the whole lesson is about separating them and choosing between them.
The whole thing first
The file is klassifikaciya.py. The data is real: the annual inflation of ten neighbours since 2000, from the World Bank. The question asked of each year: will the next one bring inflation of ten per cent or more.
"""Lesson 45: classification and the confusion matrix.

The series are real: the annual inflation of ten neighbours, the World Bank
indicator FP.CPI.TOTL.ZG. The question is yes or no: will next year's inflation
be ten per cent or higher.
"""

import numpy as np
import pandas as pd
from sklearn.linear_model import LogisticRegression
from sklearn.metrics import accuracy_score, confusion_matrix

# A country: the year its series starts and the rates themselves, in per cent.
INFLYACIYA = {
    "Azerbaijan": (2000, [1.81, 1.55, 2.77, 2.23, 6.71, 9.68, 8.33, 16.7, 20.85, 1.46,
                           5.73, 7.86, 1.07, 2.42, 1.37, 4.03, 12.44, 12.94, 2.27, 2.61,
                           2.76, 6.65, 13.85, 8.79, 2.21]),
    "Armenia": (2000, [-0.79, 3.15, 1.06, 4.72, 6.96, 0.64, 2.89, 4.41, 8.95, 3.41,
                       8.18, 7.65, 2.56, 5.79, 2.98, 3.73, -1.4, 0.97, 2.52, 1.44,
                       1.21, 7.18, 8.64, 1.98, 0.27]),
    "Belarus": (2000, [168.62, 61.13, 42.54, 28.4, 18.11, 10.34, 7, 8.43, 14.84, 12.95,
                        7.74, 53.23, 59.22, 18.31, 18.12, 13.53, 11.84, 6.03, 4.87, 5.6,
                        5.55, 9.46, 15.21, 5, 5.79]),
    "Georgia": (2000, [4.06, 4.65, 5.59, 0.84, 5.66, 8.25, 9.16, 9.24, 10, 1.73,
                      7.11, 8.54, -0.94, -0.51, 3.07, 4, 2.13, 6.04, 2.62, 4.85,
                      5.2, 9.57, 11.9, 2.49, 1.11]),
    "Kazakhstan": (2000, [13.18, 8.35, 5.84, 6.44, 6.88, 7.58, 8.72, 10.85, 17.14, 7.32,
                         7.4, 8.45, 5.2, 5.94, 6.85, 6.68, 14.36, 7.44, 6.16, 5.33,
                         6.72, 8.04, 15.03, 14.53, 8.69]),
    "Kyrgyzstan": (2000, [18.7, 6.92, 2.13, 2.97, 4.11, 4.34, 5.55, 10.23, 24.52, 6.84,
                          7.97, 16.64, 2.77, 6.61, 7.53, 6.5, 0.39, 3.18, 1.54, 1.13,
                          6.33, 11.91, 13.92, 10.75, 5]),
    "Moldova": (2000, [31.3, 9.76, 5.3, 11.75, 12.52, 11.96, 12.78, 12.37, 12.78, -0.06,
                       7.48, 7.69, 4.55, 4.6, 5.09, 9.68, 6.36, 6.57, 3.05, 4.84,
                       3.77, 5.11, 28.74, 13.42, 4.68]),
    "Russia": (2000, [20.8, 21.48, 15.79, 13.66, 10.89, 12.69, 9.67, 9.01, 14.11, 11.65,
                      6.85, 8.44, 5.07, 6.75, 7.82, 15.53, 7.04, 3.68, 2.88, 4.47,
                      3.38, 6.69, 13.74, 5.87, 8.43]),
    "Turkiye": (2000, [54.92, 54.4, 44.96, 21.6, 8.6, 8.18, 9.6, 8.76, 10.44, 6.25,
                      8.57, 6.47, 8.89, 7.49, 8.85, 7.67, 7.78, 11.14, 16.33, 15.18,
                      12.28, 19.6, 72.31, 53.86, 58.51]),
    "Uzbekistan": (2011, [13.78, 13.21, 11.84, 9.28, 8.75, 8.13, 13.88, 17.52, 14.53,
                          12.87, 10.85, 11.45, 9.96, 9.63]),
}
HIGH = 10.0        # what "high inflation" means here
CUT = 2015         # the last year of training


def pairs(data):
    """Pairs "this year -> the next". The answer exists only where both do."""
    rows = []
    for country, (first, values) in data.items():
        for i in range(len(values) - 1):
            rows.append({"country": country, "year": first + i,
                         "inflation": values[i], "next": values[i + 1]})
    table = pd.DataFrame(rows)
    table["high"] = (table["next"] >= HIGH).astype(int)
    return table


table = pairs(INFLYACIYA)
train = table[table["year"] <= CUT]
test = table[table["year"] > CUT]

print("== What is being predicted")
print("  pairs 'year -> next year':", len(table))
print("  of them with high inflation:", int(table["high"].sum()),
      f"({table['high'].mean():.0%})")
print("  training:", len(train), "pairs up to and including", CUT)
print("  the check:", len(test), "pairs after it")

print()
print("== The model that always says no")
always_no = np.zeros(len(test), dtype=int)
print("  accuracy:", round(accuracy_score(test["high"], always_no), 3))
print("  and it found none of the years, out of",
      int(test["high"].sum()))

print()
print("== Logistic regression")
model = LogisticRegression().fit(train[["inflation"]], train["high"])
guess = model.predict(test[["inflation"]])
print("  accuracy:", round(accuracy_score(test["high"], guess), 3))
print("  the gain over always-no:",
      round(accuracy_score(test["high"], guess) - accuracy_score(test["high"], always_no), 3))

print()
print("== The confusion matrix")
tn, fp, fn, tp = confusion_matrix(test["high"], guess).ravel()
print(pd.DataFrame(
    [[tn, fp], [fn, tp]],
    index=["quiet in fact", "high in fact"],
    columns=["said no", "said yes"],
).to_string())
print("  correct yes:", tp, "out of", tp + fn)
print("  false yes:", fp)
print("  missed:", fn)

print()
print("== The price of a false yes")
probability = model.predict_proba(test[["inflation"]])[:, 1]
rows = []
for threshold in (0.2, 0.3, 0.5, 0.7):
    said_yes = (probability >= threshold).astype(int)
    tn, fp, fn, tp = confusion_matrix(test["high"], said_yes).ravel()
    rows.append({"threshold": threshold, "false yes": fp, "missed": fn,
                 "accuracy": round(accuracy_score(test["high"], said_yes), 3)})
print(pd.DataFrame(rows).set_index("threshold").to_string())
print("  a threshold is a decision about the price of a mistake, not statistics")
The output:
== What is being predicted
  pairs 'year -> next year': 229
  of them with high inflation: 69 (30%)
  training: 149 pairs up to and including 2015
  the check: 80 pairs after it

== The model that always says no
  accuracy: 0.675
  and it found none of the years, out of 26

== Logistic regression
  accuracy: 0.75
  the gain over always-no: 0.075

== The confusion matrix
               said no  said yes
quiet in fact       54         0
high in fact        20         6
  correct yes: 6 out of 26
  false yes: 0
  missed: 20

== The price of a false yes
           false yes  missed  accuracy
threshold
0.2               14       4     0.775
0.3               10      10     0.750
0.5                0      20     0.750
0.7                0      23     0.713
  a threshold is a decision about the price of a mistake, not statistics
The walk-through
A yes-or-no problem begins with defining “yes”
How much is high inflation? Ten per cent in this lesson, and that is a decision rather than the data: at five, “yes” would be the majority; at fifteen, a rarity. The definition of the target is part of the model, and it is written next to it rather than kept in someone’s head.
The cut by time comes from the last lesson: train up to 2015, check on what comes after. Shuffling is out for exactly the same reason.
Accuracy lies when “yes” is rare
  always no: accuracy 0.675
  logistic: accuracy 0.75
A model that counts nothing at all and answers no to everything is right two times out of three — simply because high inflation happens in a third of the years. Any accuracy below 0.675 is worse than having no model; 0.75 sounds respectable and turns out to be an improvement of seven hundredths.
Hence the rule: in a yes-or-no problem, accuracy is read only next to the share of “yes”. On its own the number means nothing.
The confusion matrix
               said no  said yes
quiet in fact       54         0
high in fact        20         6
Four cells instead of one number, and the whole picture is in them. Top left are the correct noes, bottom right the correct yeses. The other two cells are the two kinds of mistake: a false yes (top right) and a miss (bottom left).
Here the model has no false alarms at all — and twenty misses out of twenty-six. It says no almost always, and when it says yes it is never wrong. Such a model is easy to call cautious; in fact it is useless exactly where it was meant to be used.
Choose the threshold on validation, not on the test set
           false yes  missed  accuracy
0.2               14       4     0.775
0.3               10      10     0.750
0.5                0      20     0.750
In this small teaching example, the later part of the time split is used to choose the threshold, so it is validation data rather than an independent test set. Final performance must be measured once on a later period untouched by model or threshold selection.
predict is predict_proba plus a comparison with 0.5. That half follows from nothing: it was chosen for you, and it can be moved.
Move the threshold to 0.2 and the model finds 22 of the 26 high years at the price of fourteen false alarms. Move it to 0.7 and there are no alarms at all, and no use either. Accuracy barely moves through all of this: 0.775, 0.750, 0.713 — it does not see what is happening here.
The price of a mistake is set from outside
Which threshold is right? The cheaper one — and that is not a question for the data.
If a missed year of inflation costs as much as five false alarms, the best threshold is 0.2. If it is the other way round and a false alarm costs five times a miss, the best is 0.5. The same model, the same data, a different answer. The task counts this, and it is the main lesson here: the machine counts the mistakes, and a person prices them.
What this count cannot do
There is one feature — this year’s inflation. With that feature the model cannot possibly tell a country entering a crisis from a country coming out of one: the numbers are the same and what follows is not.
And there are eighty check pairs. A matrix of four cells over eighty observations is an estimate with wide edges: one or two observations either way move both the accuracy and the number of high years found. Counting such cells to three decimals is pointless.
The lesson map
Say it in your own words
Answer out loud or on paper without looking. The answers are at the end of the lesson.
- Why does a model that always says no have an accuracy of 0.675?
- How does a false yes differ from a miss, and why can they not be added up?
- Where does the threshold of 0.5 come from, and what does moving it mean?
Warm-up
Three short steps before the task: predict, fill in, fix. The answers are at the end of the lesson, but answer for yourself first.
1. Predict. What does the program print when one year out of ten was high?
from sklearn.metrics import accuracy_score

truth = [0, 0, 0, 0, 0, 0, 0, 0, 0, 1]
always_no = [0] * 10
print("accuracy:", accuracy_score(truth, always_no))
print("high years found:", sum(1 for t, g in zip(truth, always_no) if t == g == 1))
2. Fill in the blank. In place of ... take the four numbers out of the matrix.
# the four numbers of the matrix: correct no, false yes, missed, correct yes
from sklearn.metrics import confusion_matrix

truth = [0, 0, 1, 1, 0, 1]
said = [0, 1, 1, 0, 0, 1]
tn, fp, fn, tp = ...
print("false yes:", fp, "— missed:", fn)
3. Fix it. The program prints an accuracy of 0.8 and stops there.
# accuracy alone says nothing about which mistake was made
from sklearn.metrics import accuracy_score

truth = [0, 0, 0, 0, 0, 0, 0, 0, 1, 1]
said = [0, 0, 0, 0, 0, 0, 0, 0, 0, 0]
print("accuracy:", accuracy_score(truth, said))
The task
Required. Build the pairs “year → next year”, cut them by time and check that no year ended up in both parts. Train a logistic regression and print the confusion matrix at a threshold of 0.5 — as four lines with words rather than as an array. Then walk the thresholds from 0.1 to 0.7 and print a table: false yeses, misses and accuracy. At the end work out the best threshold for two different prices of a mistake: when a miss costs five alarms and when it is the other way round.
The expected output:
== The cut by time
  training: 149 pairs, of them high 43
  the check: 80 pairs, of them high 26
  years in both parts: none

== The matrix at a threshold of 0.5
  correct no: 54
  false yes: 0
  missed: 20
  correct yes: 6

== Every threshold
           false yes  missed  accuracy
threshold
0.1               38       0     0.525
0.2               14       4     0.775
0.3               10      10     0.750
0.4                5      15     0.750
0.5                0      20     0.750
0.6                0      22     0.725
0.7                0      23     0.713

== Two different answers to one question
  a miss costs five alarms: best threshold 0.2 — false yes 14, missed 4
  an alarm costs five misses: best threshold 0.5 — false yes 0, missed 20
  one model, different answers: a threshold is not chosen by accuracy
Done means: the output matches line for line; the cells of the matrix are named in words; the price of a mistake is given as a number in the code rather than picked by eye; the best threshold is chosen by cost rather than by accuracy.
On your own data. Think of a yes-or-no question of your own — will I pass the test, will the parcel arrive this week, will the money last until payday — and write down two columns: what you expected and what happened. Even over twenty rows the matrix will show which way you err more often, and that is exactly what a single accuracy cannot tell you.
If you want more.
- Change the definition of high inflation from 10 % to 5 % and see how the share of “yes” and all four cells change.
- Add a second feature — the change in inflation over the year — and see what happens to the misses.
- Build a
precision_recall_curveand find on it the thresholds you counted by hand.
Where this goes in the project
There is no step. The digest answers with numbers, and turning it into a predictor of “will inflation be high” over three countries is exactly what the course has been arguing against since lesson forty-two.
But one rule from this lesson already works in the digest, and it is worth saying out loud: every figure on the page must show the price of being wrong about it. That is why the trend is printed with its worst miss, the link with the number of countries, and a refusal to count together with what was missing. The confusion matrix is the same idea for answers of yes and no.
The answers
To the questions
- Because high inflation happens in a third of the pairs: answering no every time, the model is right in all the others. That is not the quality of the model, it is the share of the rare answer in the data.
- A false yes is an alarm raised for nothing; a miss is one not raised in time. They cannot be added because they cost different amounts: in one place a false alarm is an hour spent and a miss is money lost, in another it is the other way round.
- The threshold of 0.5 is the default of
predict, not a property of the problem. Moving it means changing how confident the model has to be before we agree to call a year high: a lower threshold means more alarms and fewer misses, a higher one the reverse.
To the warm-up
- Nine years of ten are quiet, so “always no” is right nine times. And it did not find the one high year — which is the entire point of the warm-up.
accuracy: 0.9
high years found: 0
confusion_matrix(truth, said, labels=[0, 1]).ravel(). Thelabelsargument is not a formality: without it, data with no “yes” at all gives a 1 × 1 matrix and unpacking into four numbers breaks.
# the four numbers of the matrix: correct no, false yes, missed, correct yes
from sklearn.metrics import confusion_matrix

truth = [0, 0, 1, 1, 0, 1]
said = [0, 1, 1, 0, 0, 1]
tn, fp, fn, tp = confusion_matrix(truth, said, labels=[0, 1]).ravel()
print("false yes:", fp, "— missed:", fn)
false yes: 1 — missed: 1
- The accuracy of 0.8 was earned by a model that never once said yes. How many yeses it found has to be printed as well.
# accuracy alone says nothing about which mistake was made
from sklearn.metrics import accuracy_score, confusion_matrix

truth = [0, 0, 0, 0, 0, 0, 0, 0, 1, 1]
said = [0, 0, 0, 0, 0, 0, 0, 0, 0, 0]
tn, fp, fn, tp = confusion_matrix(truth, said, labels=[0, 1]).ravel()
print("accuracy:", accuracy_score(truth, said))
print("correct yes:", tp, "out of", tp + fn)
accuracy: 0.8
correct yes: 0 out of 2
To the task
The last two lines are what all of it was counted for. At one price of a mistake the best threshold is 0.2, at the other it is 0.5, and this is not an argument about the model: between those two lines the model did not change at all. What changed is what costs more, and that knowledge does not come from the data.
Look at the threshold of 0.1: no misses, but thirty-eight false alarms against fifty-four quiet years. A model that shouts “high inflation” at almost every year formally misses nothing — and that is exactly why nobody believes it a second time.
Sources
- confusion_matrix, scikit-learn — the order of the cells and what
labelsis for. - LogisticRegression, scikit-learn — the model and its
predict_proba. - Inflation, consumer prices, World Bank — the series the lesson is built on.
If you have found a mistake or a typo in this article, tell us about it
Comments (0)
Log in to leave a comment →
No comments yet. Be the first.