

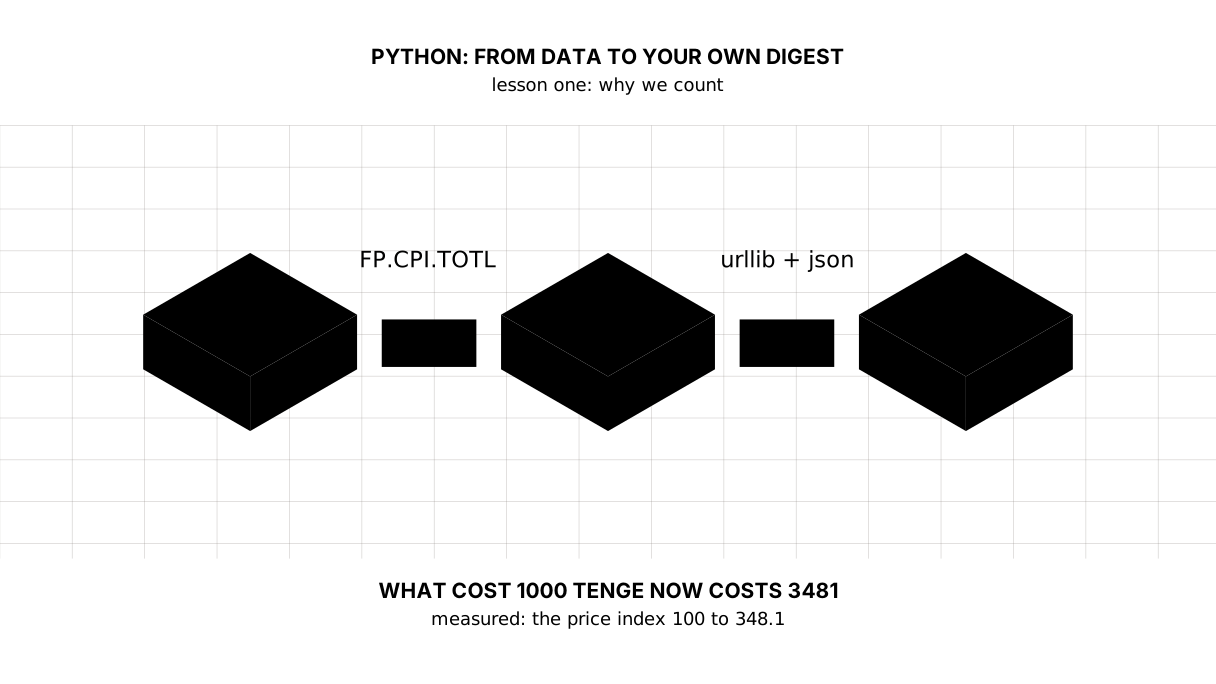
Python: from data to your own digest Lesson 1 of 56
Counting for yourself: prices, the tenge and one question
The first lesson of the Python course. No libraries have to be installed: a ready program fetches the official numbers itself. Prices in Kazakhstan are 3.48 times higher than in 2010: what cost a thousand tenge now costs 3481. And after the same shock inflation in other countries of the region is three times lower, which is the first reason to count for yourself.
Why this is needed
Numbers are quoted at you. Inflation is this. Growth is that. The one to blame is him. You cannot check what was said, so all that is left is to believe it or not.
This course is about no longer having to choose between believing and not believing. The data on prices, money and the exchange rate lies in the open; to take it and count you need one tool — Python — and a few evenings.
Let us start from the end: with the answer you will have in fifteen minutes, knowing nothing about the language yet.
The whole thing at once
First check that the language is there: in a terminal, python3 --version (on Windows, py --version). A version number means you can go on. No answer means you should start with the next lesson, where Python is installed from scratch in ten minutes, and come back here.
Make a file called tsena.py and paste this in. Nothing extra has to be installed: everything used here comes with Python. The program is longer than a first day would like — fifty lines — and it does not have to be taken apart today: what matters now is the answer, not the machinery.
"""The first program of the course: it asks the question the course was written for.

Nothing has to be installed -- everything used here comes with Python. The
program fetches the official numbers itself and counts with them.
"""

import json
import urllib.request

# The World Bank hands out country indicators with no key and no sign-up.
# FP.CPI.TOTL is the consumer price index, FP.CPI.TOTL.ZG inflation in percent.
API = "https://api.worldbank.org/v2/country/{}/indicator/{}?format=json&per_page=80&date={}:{}"


def rows(country, indicator, first, last):
    """Returns {year: value} -- whatever the World Bank answered."""
    url = API.format(country, indicator, first, last)
    with urllib.request.urlopen(url, timeout=30) as answer:
        data = json.load(answer)
    if len(data) < 2 or not data[1]:
        return {}
    return {int(item["date"]): item["value"] for item in data[1] if item["value"] is not None}


def main():
    print("== how many times prices grew in Kazakhstan")
    prices = rows("KZ", "FP.CPI.TOTL", 2010, 2025)
    base, last = min(prices), max(prices)
    times = prices[last] / prices[base]
    print(f"price index in {base}: {prices[base]:.1f}")
    print(f"price index in {last}: {prices[last]:.1f}")
    print(f"prices grew {times:.2f} times")
    # One ratio reads both ways, and mixing them up is an expensive mistake.
    print(f"1000 tenge of {last} = {1000 / times:.0f} tenge at {base} prices")
    print(f"what cost 1000 tenge in {base} costs {1000 * times:.0f} now")

    print()
    print("== one world, different prices: inflation by year, %")
    countries = {"KZ": "Kazakhstan", "WLD": "the world", "GE": "Georgia",
                 "AM": "Armenia", "PL": "Poland"}
    years = range(2021, 2026)
    print("country     " + "".join(f"{year:>7}" for year in years))
    for code, name in countries.items():
        inflation = rows(code, "FP.CPI.TOTL.ZG", 2021, 2025)
        line = "".join(f"{inflation[year]:7.1f}" if year in inflation else f"{'—':>7}"
                       for year in years)
        print(f"{name:<12}{line}")


main()
Run python3 tsena.py. The output:
== how many times prices grew in Kazakhstan
price index in 2010: 100.0
price index in 2025: 348.1
prices grew 3.48 times
1000 tenge of 2025 = 287 tenge at 2010 prices
what cost 1000 tenge in 2010 costs 3481 now

== one world, different prices: inflation by year, %
country        2021   2022   2023   2024   2025
Kazakhstan      8.0   15.0   14.5    8.7   11.4
the world       3.5    8.1    5.8    3.0    3.0
Georgia         9.6   11.9    2.5    1.1    3.9
Armenia         7.2    8.6    2.0    0.3    3.3
Poland          5.1   14.4   11.5    3.8    3.8
If there is no network
The program goes out to the internet, and that is the first thing that can fail: no connection, blocked access, somebody else’s server having a day off. When it does, take the same program with the numbers already in it — they come from that same World Bank answer, and it prints the same thing.
"""The same program without the network: the numbers are already in it.

They are taken from that same World Bank answer, so it prints the same thing.
Later in the course we will learn to fetch them ourselves.
"""

# The consumer price index: 2010 is taken as 100.
prices = {2010: 100.0, 2025: 348.1}
# Inflation by year, %; an em dash where there is no number.
inflation = {
    "Kazakhstan": {2021: 8.0, 2022: 15.0, 2023: 14.5, 2024: 8.7, 2025: 11.4},
    "the world": {2021: 3.5, 2022: 8.1, 2023: 5.8, 2024: 3.0, 2025: 3.0},
    "Georgia": {2021: 9.6, 2022: 11.9, 2023: 2.5, 2024: 1.1, 2025: 3.9},
    "Armenia": {2021: 7.2, 2022: 8.6, 2023: 2.0, 2024: 0.3, 2025: 3.3},
    "Poland": {2021: 5.1, 2022: 14.4, 2023: 11.5, 2024: 3.8, 2025: 3.8},
}

print("== how many times prices grew in Kazakhstan")
base, last = min(prices), max(prices)
times = prices[last] / prices[base]
print(f"price index in {base}: {prices[base]:.1f}")
print(f"price index in {last}: {prices[last]:.1f}")
print(f"prices grew {times:.2f} times")
print(f"1000 tenge of {last} = {1000 / times:.0f} tenge at {base} prices")
print(f"what cost 1000 tenge in {base} costs {1000 * times:.0f} now")

print()
print("== one world, different prices: inflation by year, %")
years = range(2021, 2026)
print("country     " + "".join(f"{year:>7}" for year in years))
for name, series in inflation.items():
    line = "".join(f"{series[year]:7.1f}" if year in series else f"{'—':>7}"
                   for year in years)
    print(f"{name:<12}{line}")
It prints:
== how many times prices grew in Kazakhstan
price index in 2010: 100.0
price index in 2025: 348.1
prices grew 3.48 times
1000 tenge of 2025 = 287 tenge at 2010 prices
what cost 1000 tenge in 2010 costs 3481 now

== one world, different prices: inflation by year, %
country        2021   2022   2023   2024   2025
Kazakhstan      8.0   15.0   14.5    8.7   11.4
the world       3.5    8.1    5.8    3.0    3.0
Georgia         9.6   11.9    2.5    1.1    3.9
Armenia         7.2    8.6    2.0    0.3    3.3
Poland          5.1   14.4   11.5    3.8    3.8
The numbers here are written into the program, and that is called what it is: they were not fetched, they were copied across. How the bank’s answer is built is lesson thirteen; how to go and fetch it yourself is lesson eighteen.
Taking it apart
What you have just counted
The first five lines are about the money in your pocket. The price index of 2010 is 100; in 2025 it is 348.1. So prices are 3.48 times higher, and that number reads both ways.
A thousand tenge lying in your pocket today buys what 287 tenge bought in 2010. And the other way round: what cost a thousand in 2010 is now asked 3481 tenge for. One ratio, two different sentences — and mixing them up is an error of twelvefold.
Not “about three times” and not “everybody knows”. The number was counted in front of you from an official series, and you can change the year from 2010 to 2015 and see what happens.
The same shock, different numbers
The second table matters more than the first, and here is why.
When prices rise, the explanation usually sounds like this: the world got dearer, the war, logistics, grain, oil. Let us check. In 2022 things did indeed get dearer everywhere: the world 8.1%, Kazakhstan 15.0%.
After that the paths part. By 2025 the world is back at 3.0%, Armenia at 3.3%, Georgia at 3.9%, Poland at 3.8%. Kazakhstan is at 11.4% and rising again.
The shock was shared — so it alone does not explain the difference. How much of the difference it does account for cannot be read off this table: for that you would put the structure of imports, the exchange rate, the weights in the consumer basket, the tariffs and the domestic decisions side by side. The table says something smaller and sturdier: the answer “the outside world is to blame” does not add up on it.
What follows from this, and what does not
One thing follows: “the outside world is to blame” is not a sufficient explanation. It does not survive a comparison with countries that got the same oil, the same grain and the same logistics.
But the opposite simple explanation — “they printed money” — does not add up on its own either, and we will check that too. Broad money grows by 13–18% a year in Armenia, 11–17% in Georgia and 12–21% in Kazakhstan. The growth is comparable while inflation differs three- to fourfold. So it is not one row of numbers: beside it stand the tenge’s exchange rate, the tariffs, the taxes, and where the new money goes.
The course will not hand you a ready culprit. It will hand you the ability to put four series side by side and see which one does not add up. That is sturdier than anybody else’s conclusion — ours included.
Picture it. A doctor who names the diagnosis over the phone, and a doctor who gives you the scan and teaches you to read it. The first may be right. The second cannot be fooled.
How we will learn
The Go course on this site is built on the method of Viktor Fyodorovich Shatalov, a Soviet teacher whose system let schoolchildren cover the syllabus several times faster. The second course follows it too; the system itself is described in an article about him (in Russian).
Four things are taken from it.
The whole first, the details after. Every lesson begins with a working program. You run it understanding nothing yet — as today — and only then take it apart.
The supporting signal. At the end of the walk-through comes the map of the lesson: one picture on one screen, where what matters is drawn as shapes and links. It can be photographed and kept on a phone; the point is that you can redraw it by hand.
A picture instead of a definition. Every unfamiliar term is explained with something from ordinary life. A price index is not “a basket deflator” but a ruler that had a hundred divisions in 2010 and has three hundred and forty-eight today.
The right not to understand the first time. No marks, no failed tests, no “you did not pass”. One required exercise per lesson — small and always doable — and two more if you want them.
What we will build
By the end of the course you have a digest of your own: a program that fetches fresh data itself, files it in a database, counts, draws charts, assembles a report page and runs on a schedule without you. Fifty-five lessons, from the first line to the schedule.
Along the way you will count your own personal inflation from your own receipts and compare it with the official figure; find out how much money there is per tenge of GDP and who created it; train a first model and see where it lies. In the last lessons a language model appears beside the numbers — and with it the checking of what it wrote.
One rule of the course stands apart: you are invited to check us as well. This site has already published pieces on money, banks and inflation. In the exercises you will take a claim from one of our articles and check it against open data. If it does not hold, write to us and the article gets corrected.
What you need to start
A computer, the internet and Python. Check whether you have it: type python3 --version in a terminal. If it answers with a version number, you are ready for this lesson. If not, that is the next lesson, where the language and the workplace are set up from scratch.
Nothing else: no paid course, no keys, no sign-up. The data we count is open to everybody — that is the whole point.
The map of the lesson
Say it in your own words
Without looking, answer aloud or on paper. The answers are at the end of the lesson.
- What does “the price index of 2025 is 348.1” mean, when in 2010 it was 100?
- Why is the table of other countries stronger than a single row for Kazakhstan?
- Why can these two tables not yet name the one to blame?
Warm-up
Three short steps before the exercise: predict, fill in, fix. Today they are about print — the one part of the program you can already repeat yourself. The answers are at the end of the lesson.
1. Predict. What does this line print?
print("bread", 260 * 3)
2. Fill in the gap. In place of ... put what gives the total for three loaves.
price = 260
count = 3
print(f"total: {...} tenge")
3. Fix it. The program does not start. Read what Python says and mend the line.
print("total: 780 tenge)
Exercise
Required. Run the program and change the starting year in it from 2010 to the year you were born — or any year that matters to you. Read both lines aloud: what today’s thousand is worth at that year’s prices, and what is asked today for what cost a thousand then.
If you want more.
- Add a second row of countries to the table: Kyrgyzstan (
KG), Uzbekistan (UZ), Turkey (TR). See who is near us and who is not. - Replace the indicator
FP.CPI.TOTL.ZGwithPA.NUS.FCRF, the average exchange rate to the dollar. What happened to the tenge over the same years? - Find somebody’s public claim about prices in Kazakhstan and check it with this program.
Where this goes in the project
Today’s program is the first version of our digest: it already fetches data from the world and counts something with it. Next we teach it to keep a history rather than ask for everything again, add the tenge’s rate from the National Bank, put the data in a database, draw charts and assemble a report.
The debts are visible already. The program dies without the internet and says nothing human about it. It fetches the data afresh every time, though a yearly series changes once a year. And it has not one check in it: if the World Bank answers with emptiness, we will not notice. All of that is the next few lessons.
The answers
To the questions
- That prices are 3.48 times higher: the same basket that cost 100 units in 2010 costs 348.1 in 2025. The other side of it is that a thousand of today’s tenge buys what 287 tenge bought in 2010, while the basket that cost a thousand in 2010 now costs 3481.
- Because one row can be explained by anything. A comparison tests the explanation: if a shared external shock is to blame, the countries that got the same shock should show similar numbers. They do not.
- Because a coincidence and a difference are not yet a cause. We have seen that an external shock alone cannot explain it; to name a cause you have to put money, the exchange rate, tariffs and taxes side by side — and that is the work of several lessons, not one table.
To the warm-up
bread 780.printprints everything it is given with a space between, and it works out260 * 3before printing it.
bread 780
price * count. Inside the braces of an f-string you may write a calculation and not only a name.
price = 260
count = 3
print(f"total: {price * count} tenge")
total: 780 tenge
SyntaxError: unterminated string literal— the quote was never closed. Python names the line and the place, and that is the first thing worth trusting: it shows you where it broke rather than telling you off.
print("total: 780 tenge")
total: 780 tenge
Sources
If you have found a mistake or a typo in this article, tell us about it
Comments (0)
Log in to leave a comment →
No comments yet. Be the first.