


Mathematics: from foundations to higher mathematics Lesson 43 of 51
The derivative: instantaneous rate of change
We build the derivative as a limit of average rates, connect it to tangent slope, and interpret its sign, size, and units.
This text was translated with AI.
Where we are on the map
The limit now acts on the ratio of a function change to an input change.
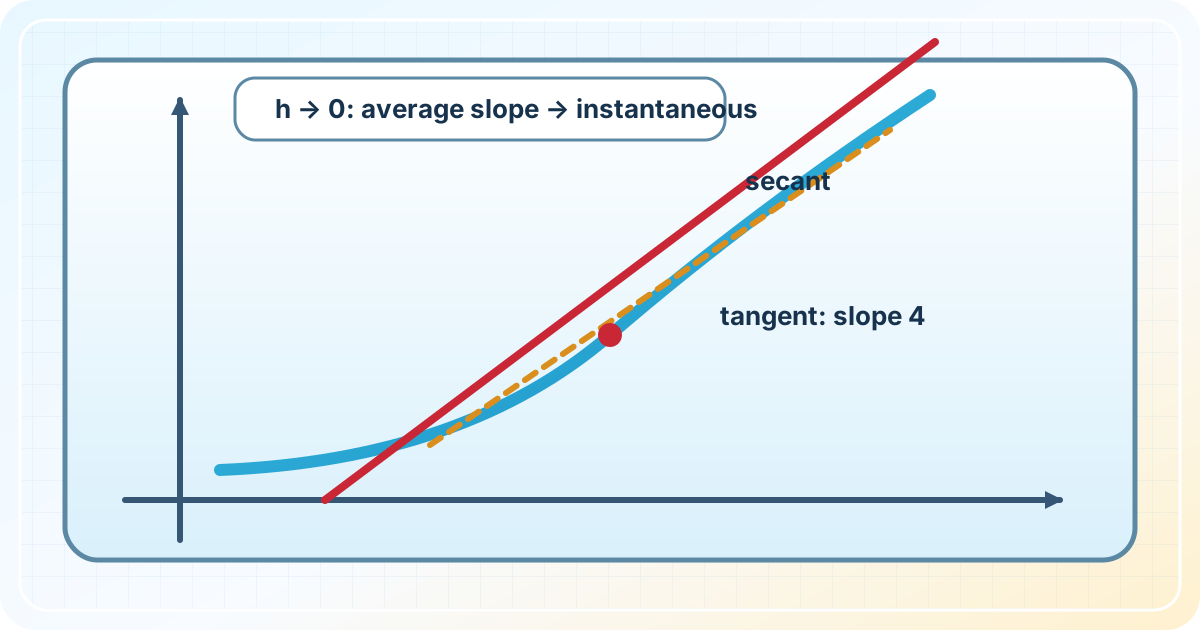
Begin with a familiar image
A speedometer reports speed now even though a car cannot travel a measurable distance in one instant. Mathematics makes the short-interval idea exact with a limit.
Precise meaning
Average rate over an interval is Δy/Δx. The derivative at a point is the limit of (f(x+h)−f(x))/h as h→0. Geometrically it is tangent slope. A positive sign means local increase and a negative sign means decrease.
The lesson’s support signal
meaning → model → calculation → check → explain in your own words
two nearby values → average slope → shrink h → limit → tangent → meaning and units
Worked example
For f(x)=x², the difference quotient is ((x+h)²−x²)/h=2x+h. Letting h→0 gives f′(x)=2x, so the slope at x=3 is 6.
Example with a fading prompt
Change the numbers in the example and repeat the solution without copying its steps. Estimate first, calculate exactly, and check against the original condition.
Recall without a prompt
- Define the main idea in one sentence.
- Rebuild the support signal from memory.
- Solve the example with different numbers and explain why every step is valid.
Find and correct the mistake
Reading f′(3)=6 as f(3)=6 is wrong. One is a local rate of change; the other is the function value.
Transfer to a new setting
Apply the same relationship to something you can measure yourself. Name the quantities, units, and the boundary within which the model is valid. Check the answer by a second representation or an inverse operation.
Exercise
Required. Use the definition to find the derivative of f(x)=3x²−2x and evaluate it at x=4. If x is seconds and f is metres, state the derivative unit.
With your own data. Create one everyday example with the same structure and show it in words, a formula, and a check.
Optional. Seven days later, change the numbers and repeat without the support map.
Open perspective
The sign and zeros of a derivative reveal graph behavior and help choose the best feasible value.
If you have found a mistake or a typo in this article, tell us about it
Comments (0)
Log in to leave a comment →
No comments yet. Be the first.