


Mathematics: from foundations to higher mathematics Lesson 54 of 59
Descriptive statistics: what data say before a model
We read a dataset through its distribution, mean, median, range, and outliers without hiding its shape behind one convenient number.
This text was translated with AI.
Where we are on the map
Probability described possible outcomes before an experiment. We now display what was actually measured.
Begin with a familiar image
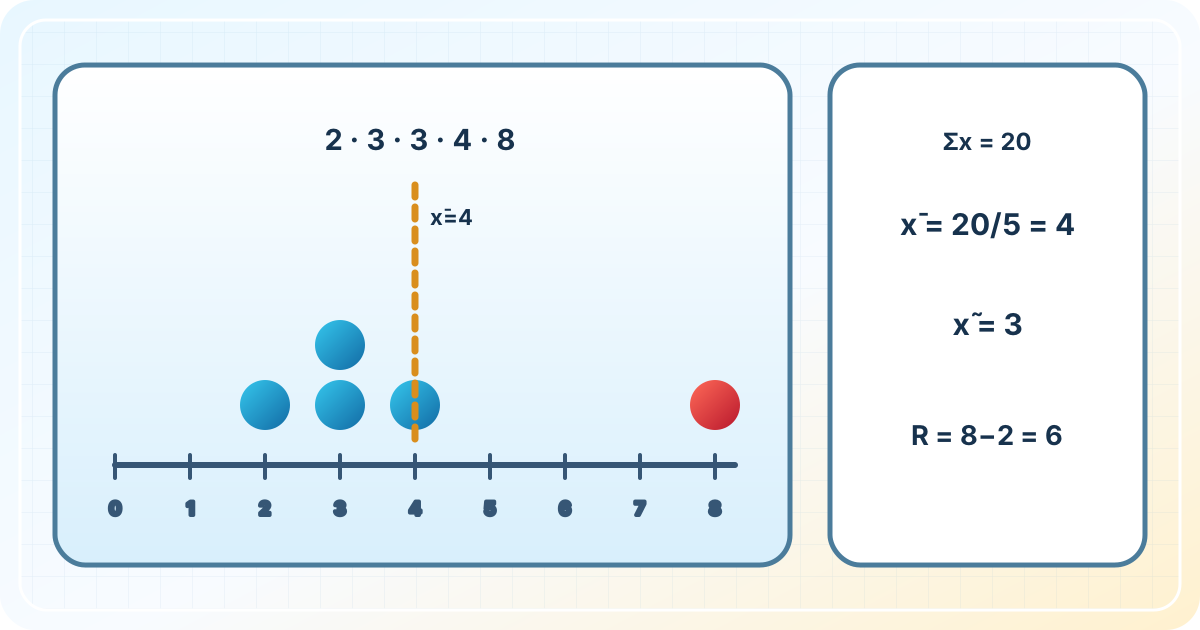
Five learners spent 2, 3, 3, 4, and 8 minutes on a problem. Eight lies apart from the others. The mean reacts to it more strongly than the median.
Precise meaning
A distribution shows values and frequencies. The mean is x̄=Σxᵢ/n, the median splits ordered data, and the mode is most frequent. Range max−min describes spread. Do not automatically delete an outlier: first check measurement and context. A graph needs axes, units, and sample size.
The lesson’s support signal
meaning → model → calculation → check → explain in your own words
question → observational unit → order data → show distribution → centre → spread → unusual points → bounded conclusion
Worked example
For 2,3,3,4,8, the sum is 20, so x̄=20/5=4. The middle value gives median 3, the mode is 3, and range is 8−2=6. A genuine 8 explains why the mean exceeds the median.
Example with a fading prompt
Change the numbers in the example and repeat the solution without copying its steps. Estimate first, calculate exactly, and check against the original condition.
Recall without a prompt
- Define the main idea in one sentence.
- Rebuild the support signal from memory.
- Solve the example with different numbers and explain why every step is valid.
Find and correct the mistake
Calling the mean salary typical without viewing the distribution is wrong. A few very large values can raise the mean; the median and distribution provide context.
Transfer to a new setting
Apply the same relationship to something you can measure yourself. Name the quantities, units, and the boundary within which the model is valid. Check the answer by a second representation or an inverse operation.
Exercise
Required. For 5,7,7,8,9,9,10,15, find mean, median, modes, range, and quartiles under a stated convention. Replace 15 with 10, recalculate, and compare each measure’s sensitivity.
With your own data. Create one everyday example with the same structure and show it in words, a formula, and a check.
Optional. Seven days later, change the numbers and repeat without the support map.
Open perspective
Describing a sample does not establish properties of a population. The next lesson makes that transition cautiously.
If you have found a mistake or a typo in this article, tell us about it
Comments (0)
Log in to leave a comment →
No comments yet. Be the first.