


Mathematics: from foundations to higher mathematics Lesson 55 of 59
Statistical inference: what a sample can say about a population
We separate population from sample, parameter from estimate, and random error from bias, then read a confidence interval without promises the data cannot support.
This text was translated with AI.
Where we are on the map
Descriptive statistics reported the observations. We now ask whether they support a wider population claim and with what uncertainty.
Begin with a familiar image
A city survey usually samples residents. Calling only landlines during working hours creates coverage bias; a large sample does not repair that design.
Precise meaning
A population is the group of interest; a sample is the observed part. An unknown population parameter is estimated by a sample statistic. Standard error describes random variation. A confidence interval belongs to a repeated procedure that covers the true parameter at its stated rate. Association in observational data does not prove causation.
The lesson’s support signal
meaning → model → calculation → check → explain in your own words
question → population → sampling design → estimate → random error → interval → biases → supported conclusion
Worked example
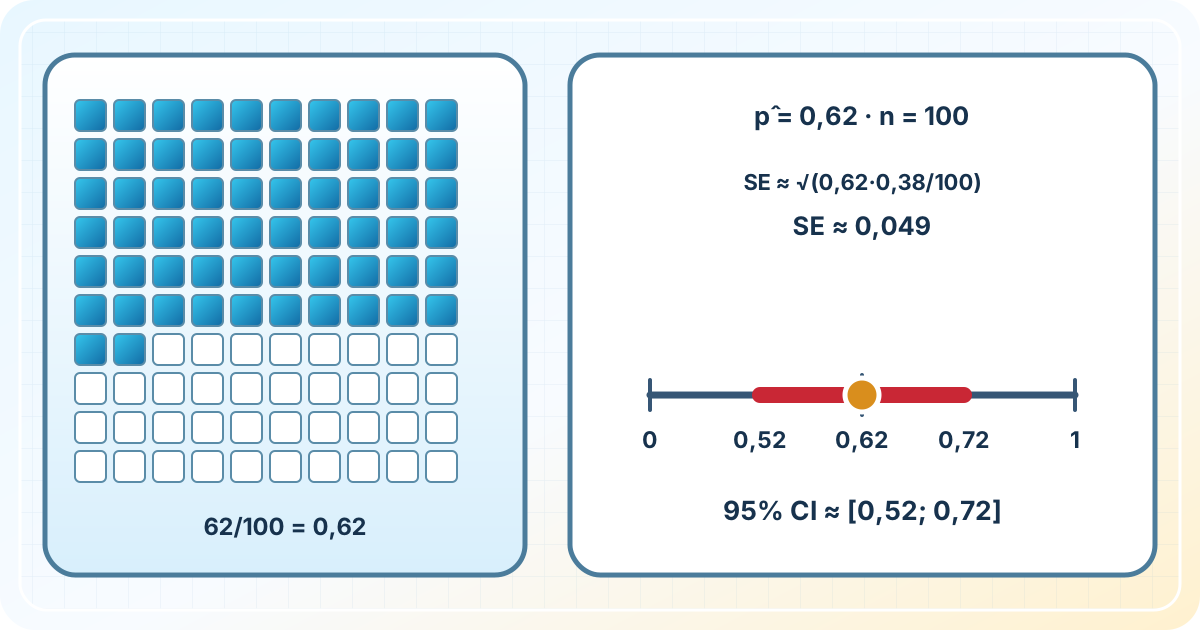
With 62 successes among n=100, p̂=0.62. SE≈√(0.62·0.38/100)≈0.049, so 0.62±1.96·0.049 is about [0.52,0.72]. It reflects random error, but does not fix biased selection.
Example with a fading prompt
Change the numbers in the example and repeat the solution without copying its steps. Estimate first, calculate exactly, and check against the original condition.
Recall without a prompt
- Define the main idea in one sentence.
- Rebuild the support signal from memory.
- Solve the example with different numbers and explain why every step is valid.
Find and correct the mistake
Saying a completed interval has a 95% probability of containing the parameter misstates the frequentist meaning. The parameter is fixed; 95% describes coverage of the repeated procedure.
Transfer to a new setting
Apply the same relationship to something you can measure yourself. Name the quantities, units, and the boundary within which the model is valid. Check the answer by a second representation or an inverse operation.
Exercise
Required. In a random sample of 225 observations, 126 have a feature. Find p̂, an approximate standard error, and a 95% interval. Name two biases it misses and write one supported and one unsupported conclusion.
With your own data. Create one everyday example with the same structure and show it in words, a formula, and a check.
Optional. Seven days later, change the numbers and repeat without the support map.
Open perspective
The next lesson uses logic to make explicit which conclusions follow from evidence and which do not.
If you have found a mistake or a typo in this article, tell us about it
Comments (0)
Log in to leave a comment →
No comments yet. Be the first.