


Physics around us: from a first experiment to your own lab Lesson 15 of 28
Position-time graph: a journey told in points
Identify time and position on a graph and what the drawing cannot tell us.
Where we are on the map
This is the second block. Keep the question, data, and source of each number in My World Lab Notebook. The numbers in the map are a worked model, not a measurement you performed.
A scene from everyday life
We observe a cart every two seconds. Instead of a long account—“first here, then there”—we write pairs of numbers. A graph shows the order: each point answers “where was it at this time?” It does not draw the real shape of the track.
New words, step by step
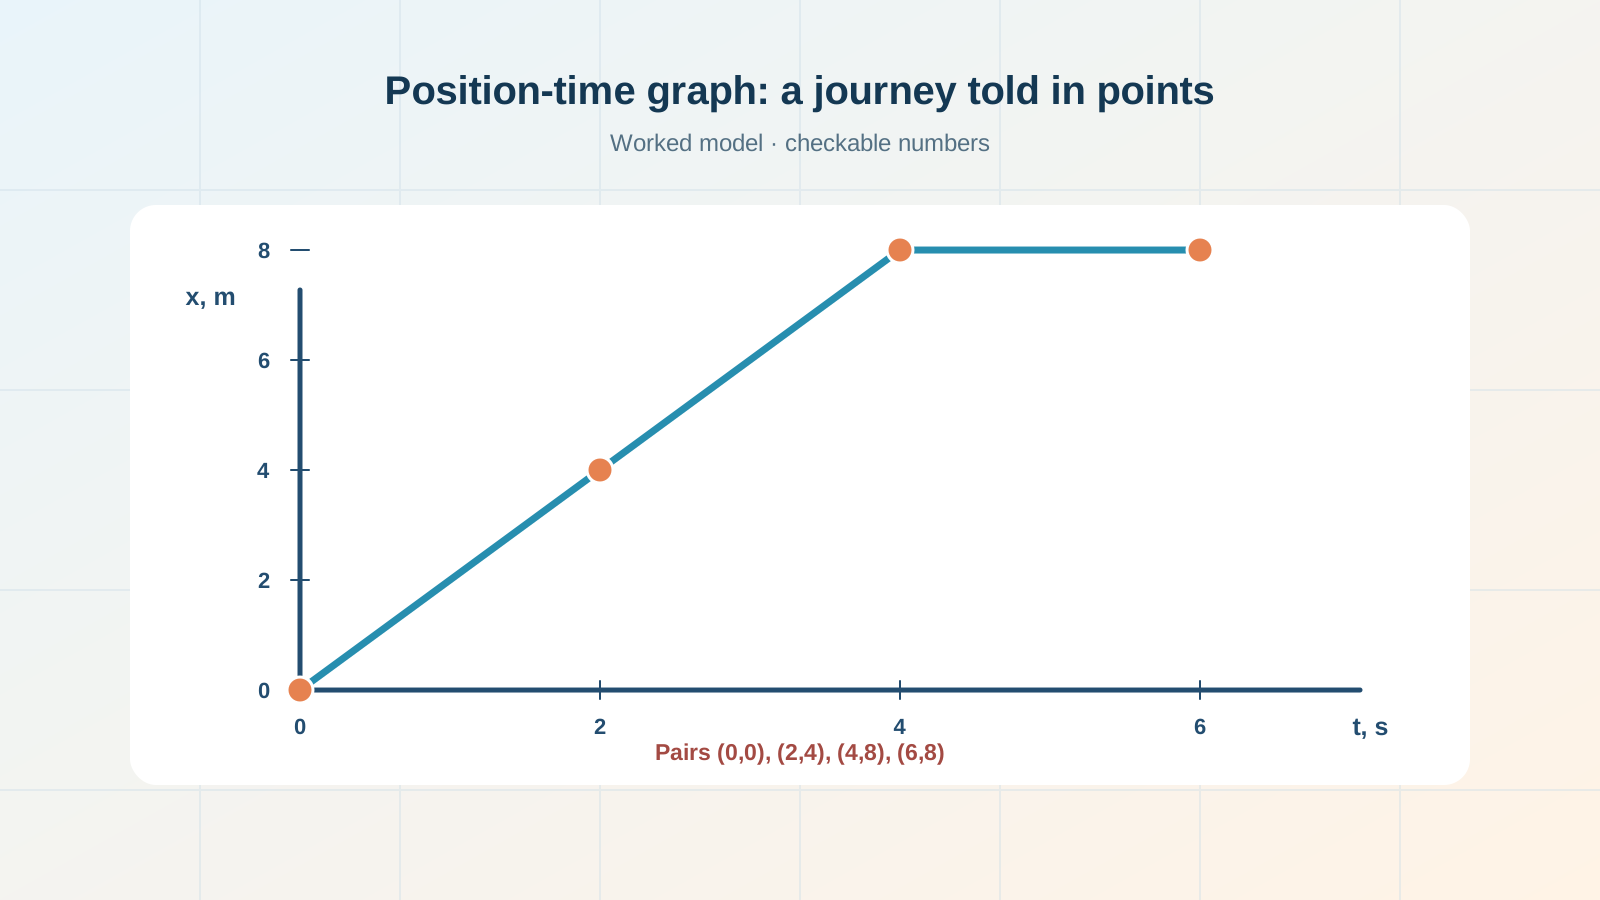
A position-time graph x(t) plots position x against time t. The horizontal axis is time in seconds; the vertical one is position in metres. A data pair (t, x) belongs to one observation. A line between measured points may be a model, but without extra observations it does not prove that motion followed that line.
Work through the numbers
Worked data: (0 s, 0 m), (2 s, 4 m), (4 s, 8 m). The points lie on one straight line. If we assume steady motion between them, position increases by 4 m every 2 s. Yet three snapshots cannot rule out a brief stop between snapshots.
Your paper investigation
Draw the axes and points. Add a fourth worked point (6 s, 8 m): position did not change from 4 to 6 s, so the cart may have stood still. Label the horizontal stretch a model consistent with data, not a continuous video record.
An easy mistake to make
Do not read a sloping line as a sloping track. The vertical axis represents position along the chosen line, not the height above the floor.
Check your understanding
Close the worked example and explain aloud: what was given, what was calculated, and in which units? Change one number in the question and say which calculation must be repeated. If you need a word you do not yet understand, return to its definition above.
Notebook entry
Record the answer with units and one short limit: what does this example not yet prove? If you did not perform a trial, label the numbers “worked data.”
If you have found a mistake or a typo in this article, tell us about it
Comments (0)
Log in to leave a comment →
No comments yet. Be the first.