


Physics around us: from a first experiment to your own lab Lesson 16 of 28
Graph slope and speed
See why a steeper position line means more change in the same time.
Where we are on the map
This is the second block. Keep the question, data, and source of each number in My World Lab Notebook. The numbers in the map are a worked model, not a measurement you performed.
A scene from everyday life
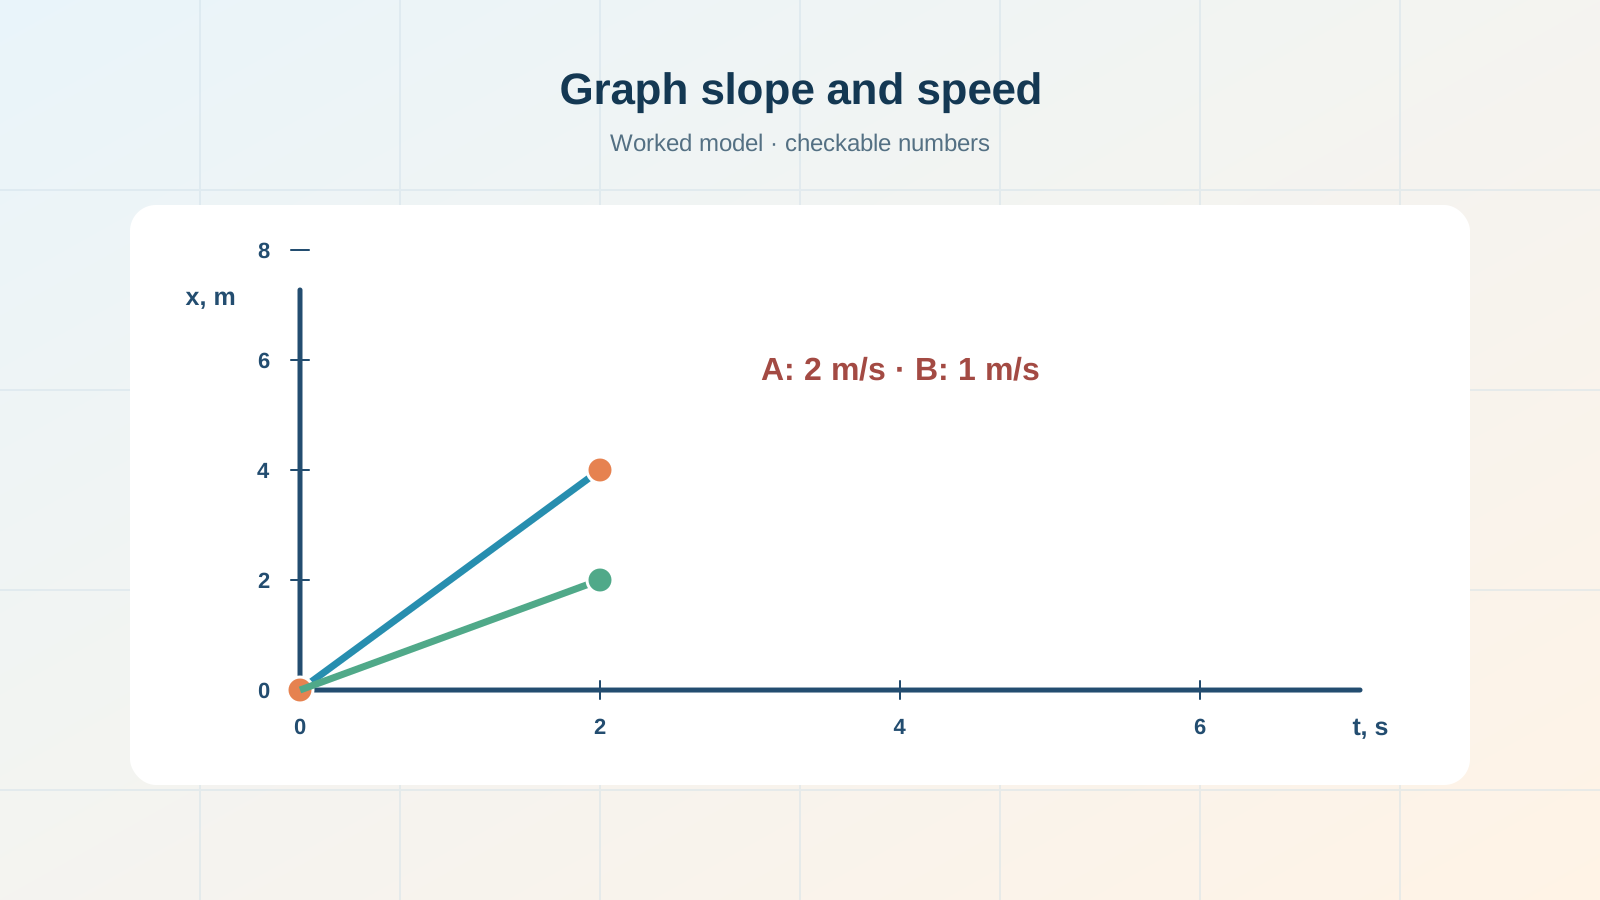
One cart’s graph rises steeply and another rises gently. But what does “steep” mean if you can rotate the paper? Compare numbers on labelled axes: how many metres did position change over the same number of seconds? Colour and drawing size cannot answer.
New words, step by step
The slope of a section of x(t) is change in position divided by change in time: Δx/Δt. For straight-line motion without reversal, its numerical value equals the speed on that section. The unit is m/s. Apparent steepness on paper depends on axis scales, but the calculated physical ratio does not change when you stretch the drawing.
Work through the numbers
Line A goes from (0 s, 0 m) to (2 s, 4 m): Δx/Δt = 4/2 = 2 m/s. Line B goes from (0 s, 0 m) to (2 s, 2 m): 2/2 = 1 m/s. In the same 2 s, A changes position by 4 m and B by 2 m. These are worked diagram values, not experiments.
Your paper investigation
Draw both lines on the same axes. Beside them write the two differences: A, 4 m in 2 s; B, 2 m in 2 s. Change the vertical scale for both equally. Explain why their calculated speeds remain 2 and 1 m/s.
An easy mistake to make
Do not count grid squares without reading the axis labels. Four squares up need not mean 4 m: one square might represent 0.5 m.
Check your understanding
Close the worked example and explain aloud: what was given, what was calculated, and in which units? Change one number in the question and say which calculation must be repeated. If you need a word you do not yet understand, return to its definition above.
Notebook entry
Record the answer with units and one short limit: what does this example not yet prove? If you did not perform a trial, label the numbers “worked data.”
If you have found a mistake or a typo in this article, tell us about it
Comments (0)
Log in to leave a comment →
No comments yet. Be the first.