

Physics around us: from a first experiment to your own lab Lesson 84 of 84
The sky as a lab: explain a day, a season and a Moon phase
Build a testable investigation instead of a memorised list.
Question and prediction
A friend says: ‘Summer is warmer because Earth is closer to the Sun; a crescent is Earth’s shadow.’ Do not appeal to authority. Build three small models, each testing a different part of the claim: rotation, axial tilt and the Moon’s illuminated half.
New words without gaps
A claim is a statement testable with an observation or calculation. A model is a simplified representation preserving the relevant relationship. A limit is what the model does not show. A source identifies where a number or observation came from. Honest conclusions separate your own observation from a supplied calculation and a prediction. Agreement with one example does not prove that a model explains the whole sky.
Work through supplied data
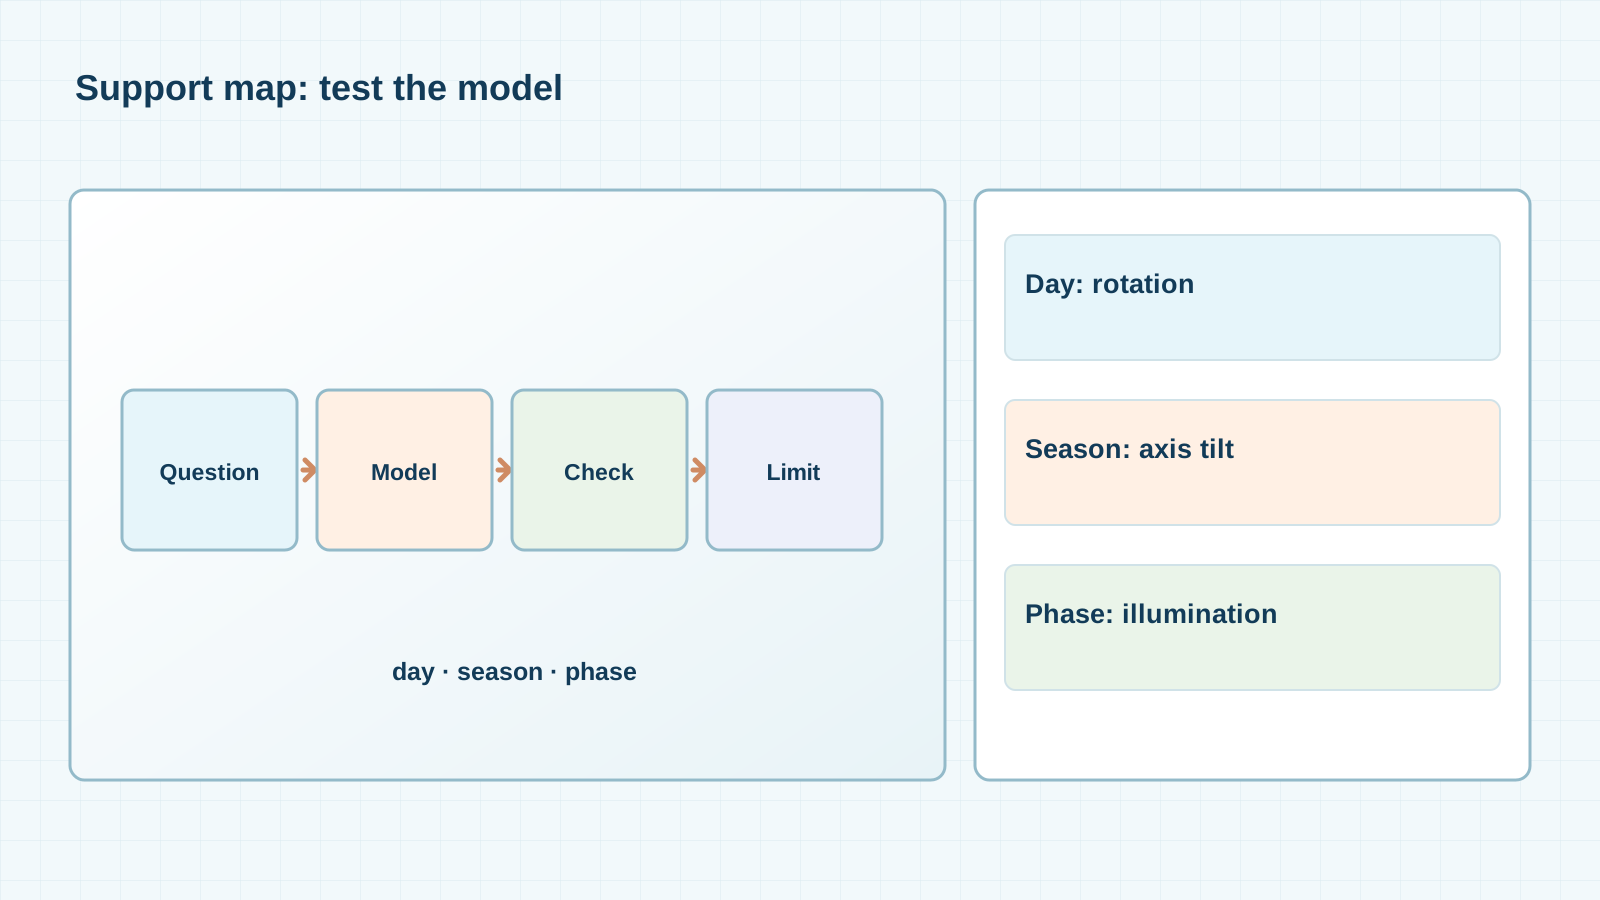
Supplied reference values: Earth turns about once per day; its axis tilts about 23.4°; lunar phases repeat after about 29.5 days; sunlight arrives after about eight minutes. These numbers explain different things and do not belong in one formula. Four cards in the diagram follow the reasoning order: question → model → observable consequence → limit. Each row must address one phenomenon, not claim an answer to everything.
Test safely
Make a lab notebook table: phenomenon, prediction, light-direction drawing, observable check, source and limit. For a day, mark a spot on a rotating globe. For seasons, compare hemispheres while keeping the axis direction fixed. For a phase, show the bright half of a ball. All work can be done on paper; do not invent an observation you did not make.
A common mistake
Review another learner’s explanation. If a phase is called Earth’s shadow, ask why eclipses do not happen monthly. If a season is blamed on distance, ask them to compare north and south in July. Keep two questions that these models leave open for the next block.
Support diagram
Check your understanding
Close the text and explain the left-to-right drawing to a new learner. Name an observation, a teaching assumption and something the evidence does not prove. Then answer the transfer question without a hint and check units or direction against the diagram. If you disagree, return to the first unfamiliar word rather than memorising a sentence. A spoken explanation, a drawing and a measurement are different kinds of evidence: label each honestly.
Lab notebook page
Add a line to My World Lab Notebook: question → prediction → controlled conditions → changed condition → observation or calculation → conclusion → limit. Put a scale on a drawing or mark it ‘schematic’. If you ran no experiment, write ‘supplied calculation’, not ‘we measured’. Revisit the entry after the next lesson and note what became clearer.
Source for values and model: NASA Science.
If you have found a mistake or a typo in this article, tell us about it
Comments (0)
Log in to leave a comment →
No comments yet. Be the first.