

Physics around us: from a first experiment to your own lab Lesson 82 of 84
Why are the planets crowded together on posters?
Measure the Solar System in astronomical units.
Question and prediction
A colourful poster squeezes eight planets into one close row. If we mark their real average orbital distances on a common scale, where must Jupiter go? Predict in centimetres before doing the conversion.
New words without gaps
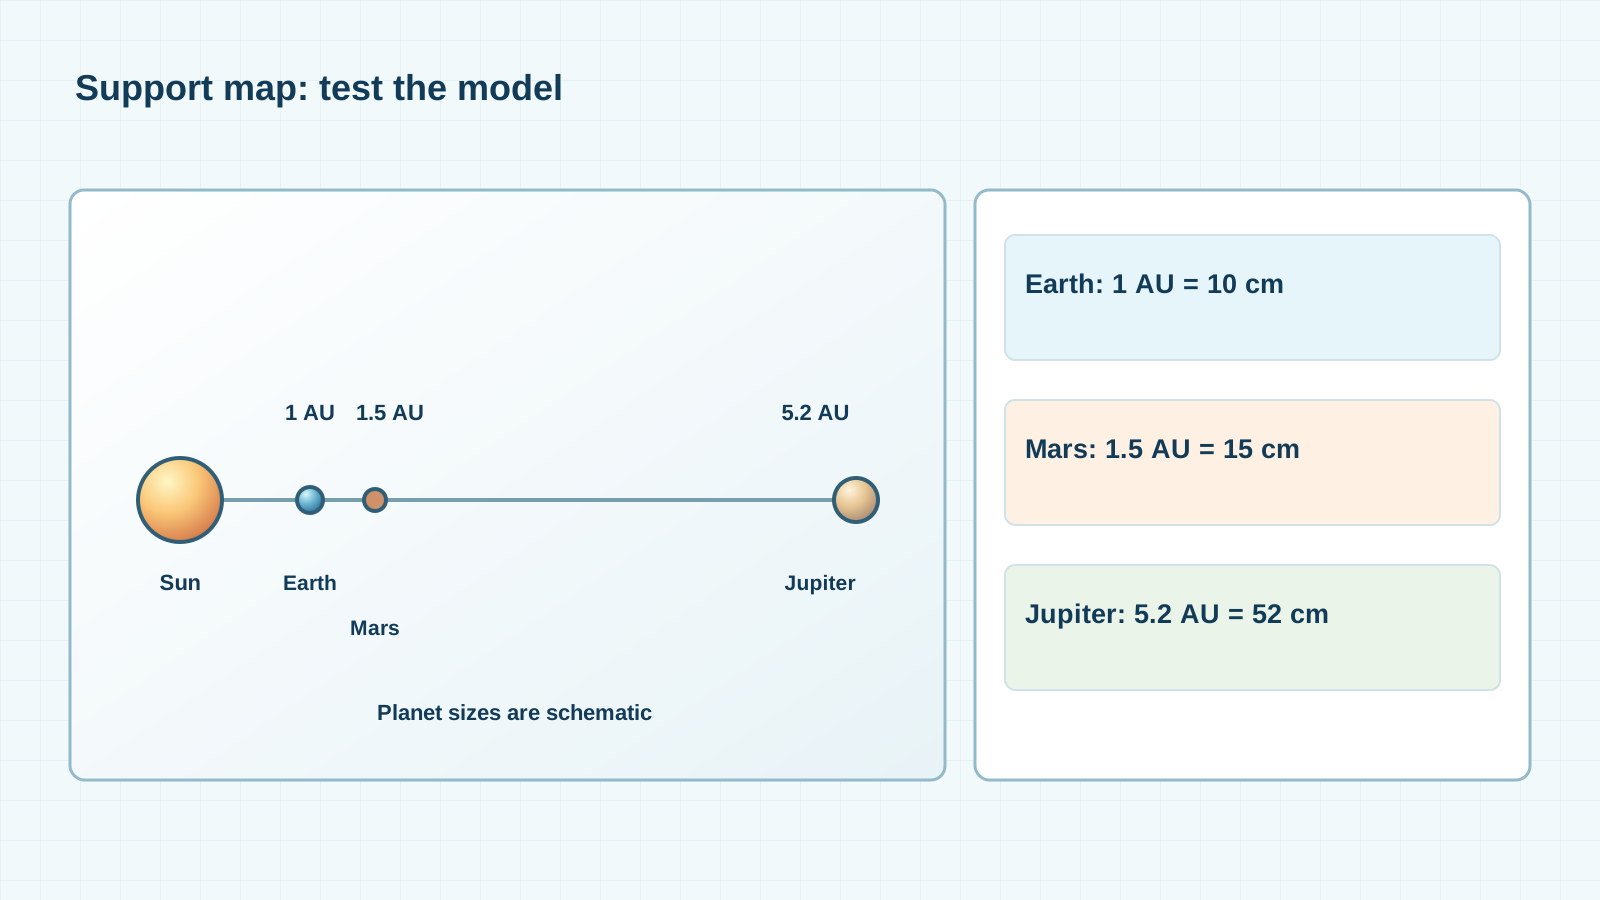
An astronomical unit, AU, is a length close to Earth’s average distance from the Sun: about 150 million km. It is not a time unit. Mars has an average Sun distance of about 1.5 AU, Jupiter 5.2 AU and Neptune 30 AU. Planets do not all line up at once. These are average orbital distances from the Sun, not their separations from one another on a particular date.
Work through supplied data
Supplied scale: 1 AU = 10 cm. Put model Earth 10 cm from the Sun, Mars 15 cm, Jupiter 52 cm and Neptune about 3 m away. The diagram focuses on the first three marks, so Jupiter is at 52 cm, not 5.2 cm. Planet diameters on this distance drawing are not to scale. Never mix a size scale and a distance scale without a label.
Test safely
If you have space, lay out at least three metres of paper tape. Mark the Sun at zero and four orbit positions. A table is equally valid: object, AU, model centimetres. There is no need to go into a road to build a large model; a desk calculation is enough.
A common mistake
Mistake: Earth and Mars are always 0.5 AU apart. That is merely the difference between average Sun distances; planets move. How many model centimetres correspond to an object at 2.5 AU?
Support diagram
Check your understanding
Close the text and explain the left-to-right drawing to a new learner. Name an observation, a teaching assumption and something the evidence does not prove. Then answer the transfer question without a hint and check units or direction against the diagram. If you disagree, return to the first unfamiliar word rather than memorising a sentence. A spoken explanation, a drawing and a measurement are different kinds of evidence: label each honestly.
Lab notebook page
Add a line to My World Lab Notebook: question → prediction → controlled conditions → changed condition → observation or calculation → conclusion → limit. Put a scale on a drawing or mark it ‘schematic’. If you ran no experiment, write ‘supplied calculation’, not ‘we measured’. Revisit the entry after the next lesson and note what became clearer.
Source for values and model: NASA Science.
If you have found a mistake or a typo in this article, tell us about it
Comments (0)
Log in to leave a comment →
No comments yet. Be the first.