


Physics around us: from a first experiment to your own lab Lesson 87 of 92
When will the last radioactive atom disappear?
Calculate half-life without pretending to predict one nucleus's date.
Question and prediction
Imagine 80 identical sealed envelopes. Some randomly ‘open’ over time. Can you name the first envelope to open? No. Can you reasonably predict how many remain closed after equal intervals? Yes, provided each has the same stable chance. This is a statistical analogy, not an experiment with radioactive material.
New words without gaps
Radioactivity is the spontaneous change of an unstable nucleus that emits particles or electromagnetic radiation. One such change is a decay. A half-life is the time in which, on average, half the nuclei in a large initial group decay. ‘On average’ matters: it cannot tell us when one particular nucleus will decay. The remaining count refers to the original radioactive material. Decay products still exist and may themselves be radioactive.
Work through supplied data
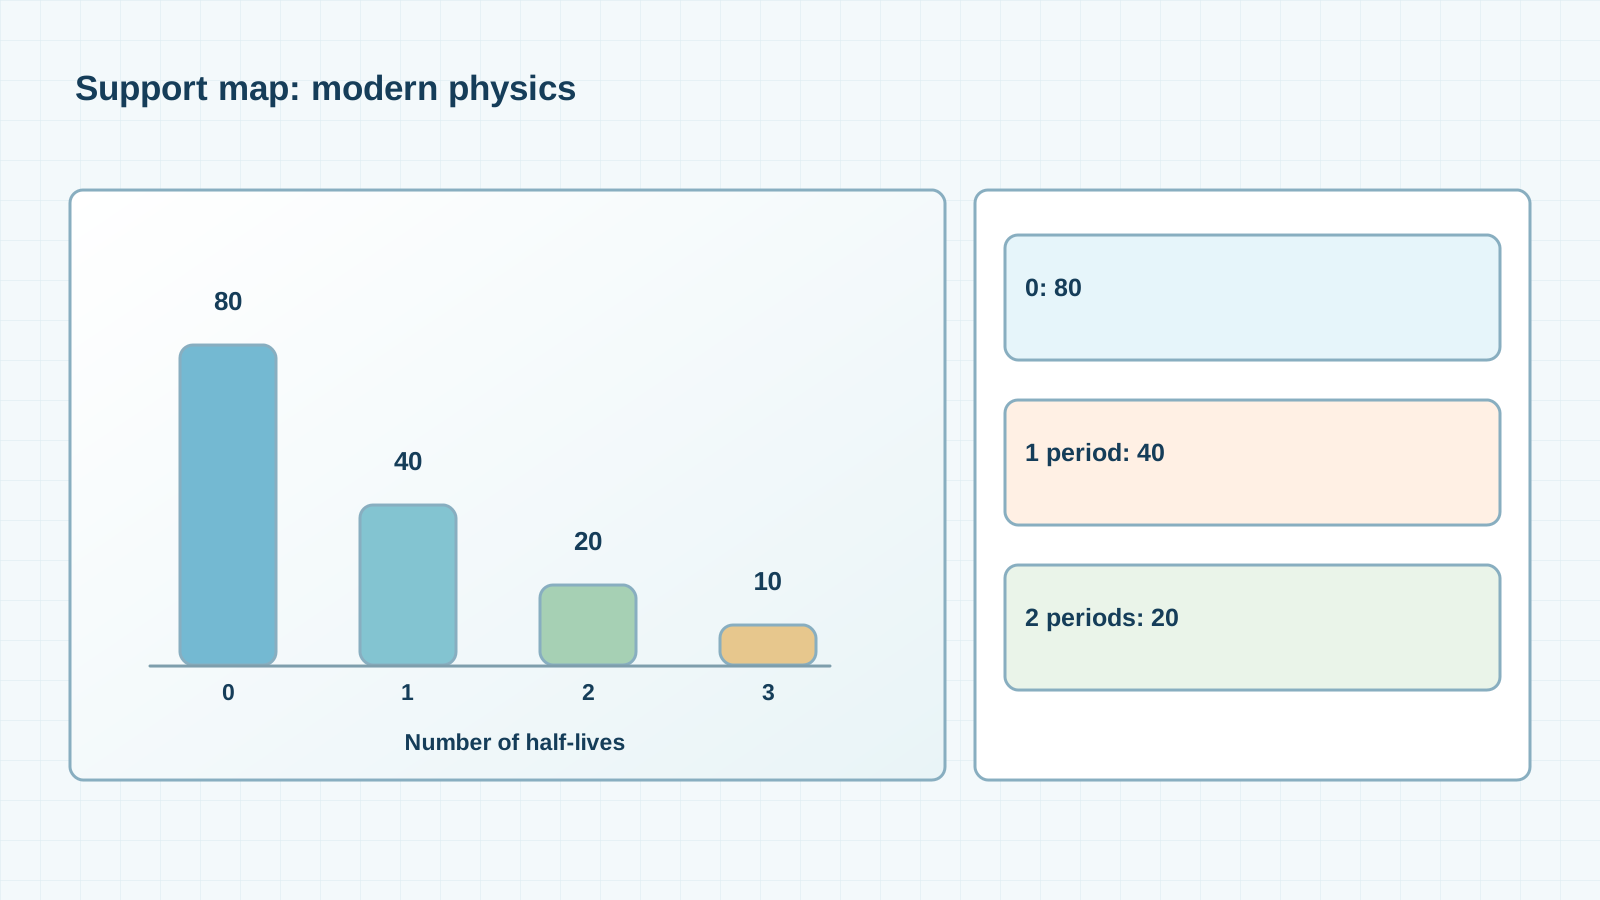
Supplied model with 80 nuclei: after one half-life expect 40 original nuclei; after two, 20; after three, 10. Halve the current count at each step, rather than subtracting 40 each time. If this invented model uses a five-day half-life, mark 0, 5, 10 and 15 days. Five days is not a claim about any named isotope. Even many half-lives do not predict the exact date when the final atom disappears.
Test safely
Draw four columns containing 80, 40, 20 and 10 paper dots. Label each by the number of elapsed half-lives. Separately count the expected decays: 80−40=40, 40−20=20, 20−10=10. The number changing each interval falls. You need no radioactive source: paper or a screen is sufficient.
A common mistake
Mistake: subtracting the same forty atoms every interval. It is also wrong to promise that one nucleus will decay exactly one half-life from now. Transfer: starting with 160 original nuclei and roughly 80 after one period, how many do you expect after two and three? Why might a small real sample differ?
Support diagram
Check your understanding
Close the text and explain the left-to-right drawing to a new learner. Name an observation, a teaching assumption and something the evidence does not prove. Then answer the transfer question without a hint and check units or direction against the diagram. If you disagree, return to the first unfamiliar word rather than memorising a sentence. A spoken explanation, a drawing and a measurement are different kinds of evidence: label each honestly.
Lab notebook page
Add a line to My World Lab Notebook: question → prediction → controlled conditions → changed condition → observation or calculation → conclusion → limit. Put a scale on a drawing or mark it ‘schematic’. If you ran no experiment, write ‘supplied calculation’, not ‘we measured’. Revisit the entry after the next lesson and note what became clearer.
Evidence source: www.epa.gov.
Next lesson: Are sunlight, X-rays and radioactivity the same thing?
If you have found a mistake or a typo in this article, tell us about it
Comments (0)
Log in to leave a comment →
No comments yet. Be the first.