


Physics around us: from a first experiment to your own lab Lesson 90 of 92
Why does a gas have its own set of coloured lines?
Connect a spectrum to gaps between allowed atomic energies.
Question and prediction
A prism can make a continuous rainbow, but some thin gases give separate bright lines. Why are the patterns different? Do not rush to say the gas ‘has fewer colours’. Recall that a photon carries a particular energy and an atom need not allow every possible electron energy. Predict whether the pattern can tell us something about the material.
New words without gaps
An energy level is an allowed state of an atom with a particular energy. A transition is a change from one level to another. When an atom changes from higher to lower energy, it may emit a photon. A spectrum is light distributed by wavelength or frequency; distinct lines reflect some allowed energy differences. The colour of a visible line depends on photon frequency. Levels do not prove that an electron travels on a ball-like orbit: they describe states, not tracks.
Work through supplied data
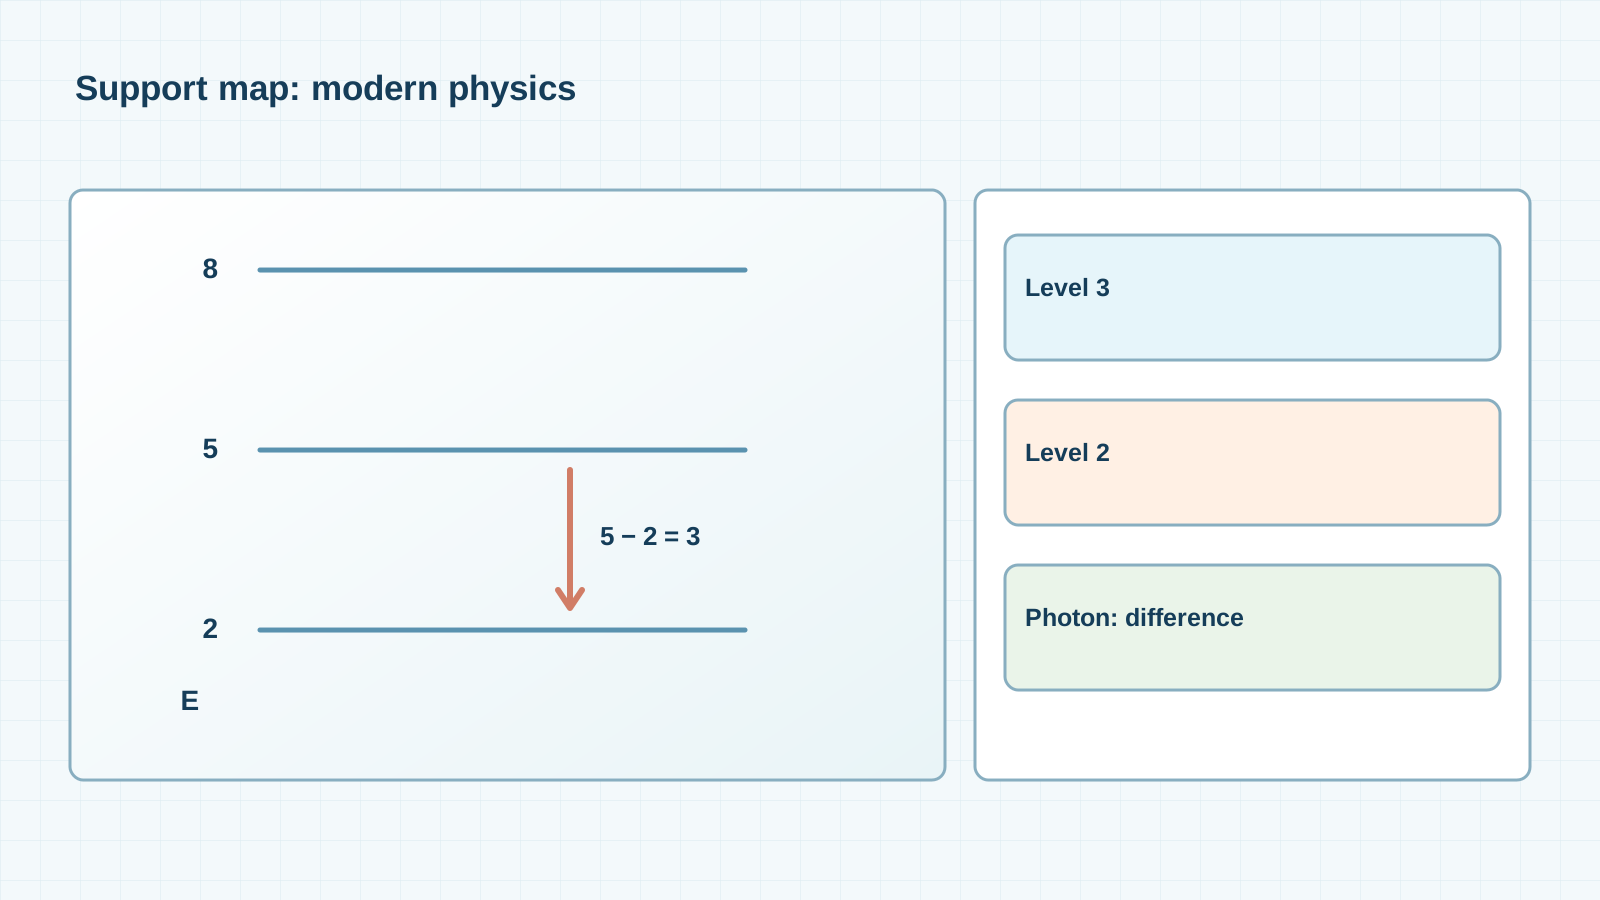
Invented teaching atom: levels have energies 2 and 5 arbitrary units. For a 5 → 2 transition, the difference is 3 units, so the emitted photon has 3 units of energy. The reverse transition needs absorption of 3 units under suitable conditions. These are made-up arithmetic levels, not hydrogen data. On the map, horizontal lines at heights labelled 2 and 5 are linked by exactly one vertical arrow.
Test safely
Draw two horizontal lines on graph paper, one at height 2 squares and the other at 5. Draw a downward arrow and compute 5−2. Add a third level at height 8 and list positive differences between every pair. Keep the invented model separate from measured spectra; the NIST database provides reference data for real atoms.
A common mistake
Mistake: treating an energy level as a literal shelf five centimetres from the nucleus. The vertical axis represents energy, not distance. Transfer: what three gaps exist among levels 2, 5 and 8? Can different pairs yield the same gap? Check by subtracting.
Support diagram
Check your understanding
Close the text and explain the left-to-right drawing to a new learner. Name an observation, a teaching assumption and something the evidence does not prove. Then answer the transfer question without a hint and check units or direction against the diagram. If you disagree, return to the first unfamiliar word rather than memorising a sentence. A spoken explanation, a drawing and a measurement are different kinds of evidence: label each honestly.
Lab notebook page
Add a line to My World Lab Notebook: question → prediction → controlled conditions → changed condition → observation or calculation → conclusion → limit. Put a scale on a drawing or mark it ‘schematic’. If you ran no experiment, write ‘supplied calculation’, not ‘we measured’. Revisit the entry after the next lesson and note what became clearer.
Evidence source: www.nist.gov.
Next lesson: Why can a satellite clock not simply copy time on Earth?
If you have found a mistake or a typo in this article, tell us about it
Comments (0)
Log in to leave a comment →
No comments yet. Be the first.