

Physics around us: from a first experiment to your own lab Lesson 96 of 100
Did the surface alone cause the difference?
Compare both series and look for rival causes.
Question and prediction
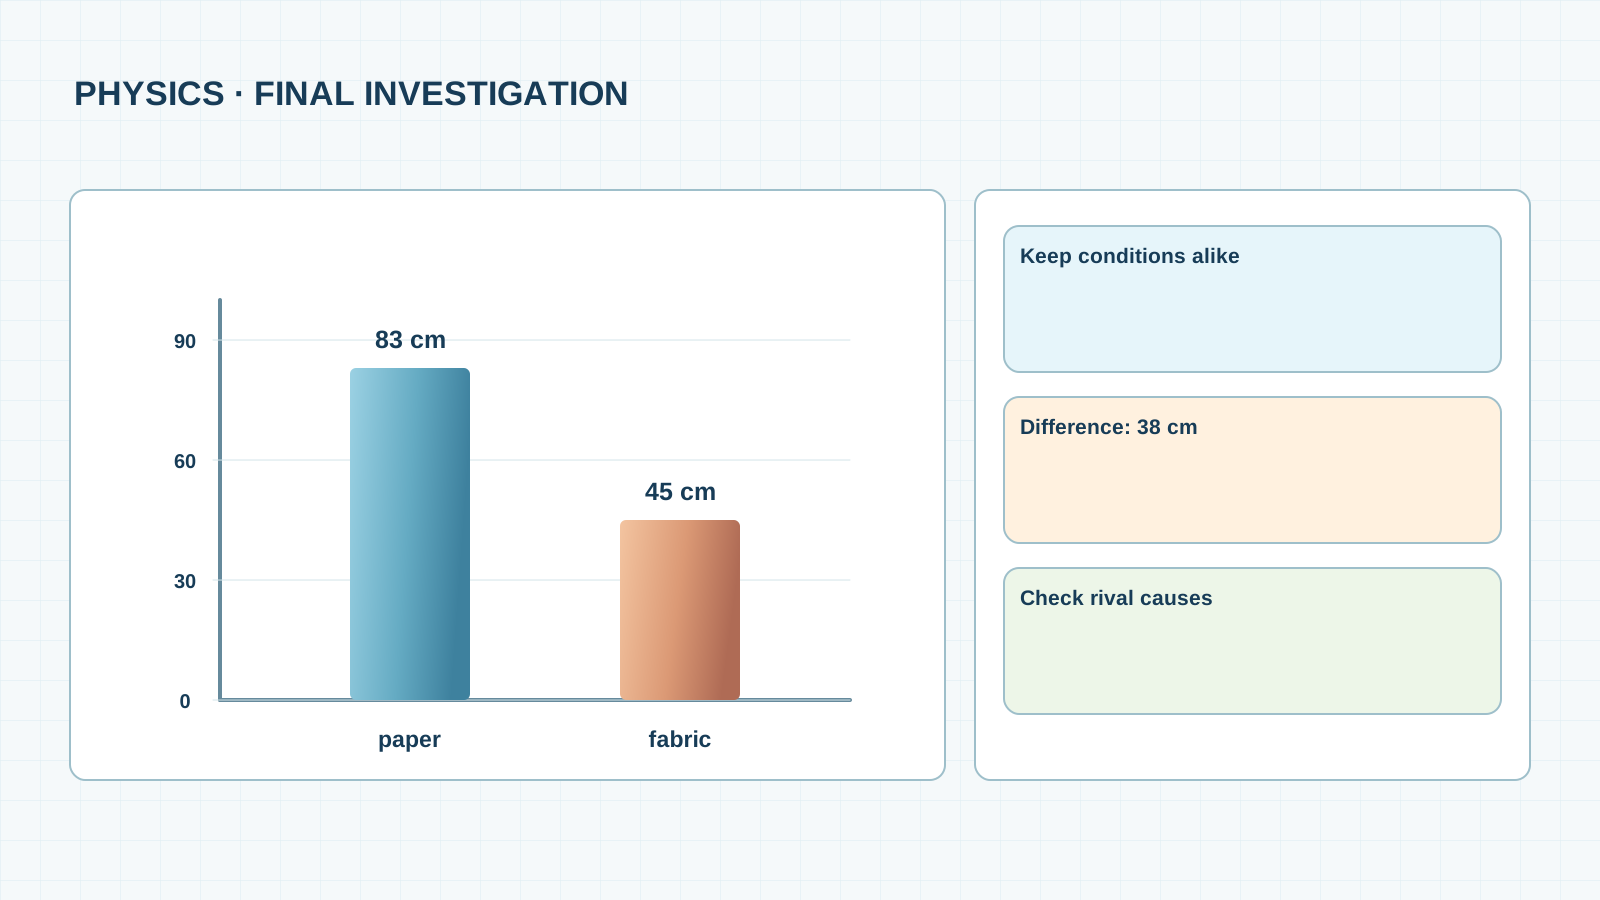
Mean distance is 83 cm on paper and 45 cm on fabric. The difference is large. But imagine lowering the ramp or letting a wheel rub the axle before the second series. Distance could change without any fabric effect. A good investigation seeks evidence and rival explanations.
New words without gaps
A fair comparison changes one chosen condition while keeping other important conditions alike. A rival explanation is another factor that could cause the outcome. Control does not mean making everything in the world perfectly equal: name likely influences and check them. Wheel friction, air resistance and a crooked axle may all act; one distance does not measure their separate effects.
Work through supplied data
In the supplied data, 83 − 45 = 38 cm. Individual runs are also separated: paper 82–84 cm, fabric 44–46 cm. Under the stated conditions this agrees with a shorter run on fabric. It does not yield a friction coefficient or promise exactly 38 cm with another wheel or covering.
Test safely
Make a control table: cart, release height, ramp angle, zero mark, wheel condition and covering width. Write how each was held alike. If you use only supplied data, clearly say that these controls were planned, not actually carried out by you.
A common mistake
Mistake: saying “fabric has 38 cm more friction”: centimetres measure distance, not force. Transfer: fabric snags an axle differently on each run. How would you secure it, and how could you detect the defect?
Support diagram
Check your understanding
Close the text and explain the left-to-right drawing to a new learner. Name an observation, a teaching assumption and something the evidence does not prove. Then answer the transfer question without a hint and check units or direction against the diagram. If you disagree, return to the first unfamiliar word rather than memorising a sentence. A spoken explanation, a drawing and a measurement are different kinds of evidence: label each honestly.
Lab notebook page
Add a line to My World Lab Notebook: question → prediction → controlled conditions → changed condition → observation or calculation → conclusion → limit. Put a scale on a drawing or mark it ‘schematic’. If you ran no experiment, write ‘supplied calculation’, not ‘we measured’. Revisit the entry after the next lesson and note what became clearer.
Next lesson: How do we graph data without misleading people?
If you have found a mistake or a typo in this article, tell us about it
Comments (0)
Log in to leave a comment →
No comments yet. Be the first.