


Physics around us: from a first experiment to your own lab Lesson 97 of 100
How do we graph data without misleading people?
Draw a chart with correct units and a zero-based scale.
Question and prediction
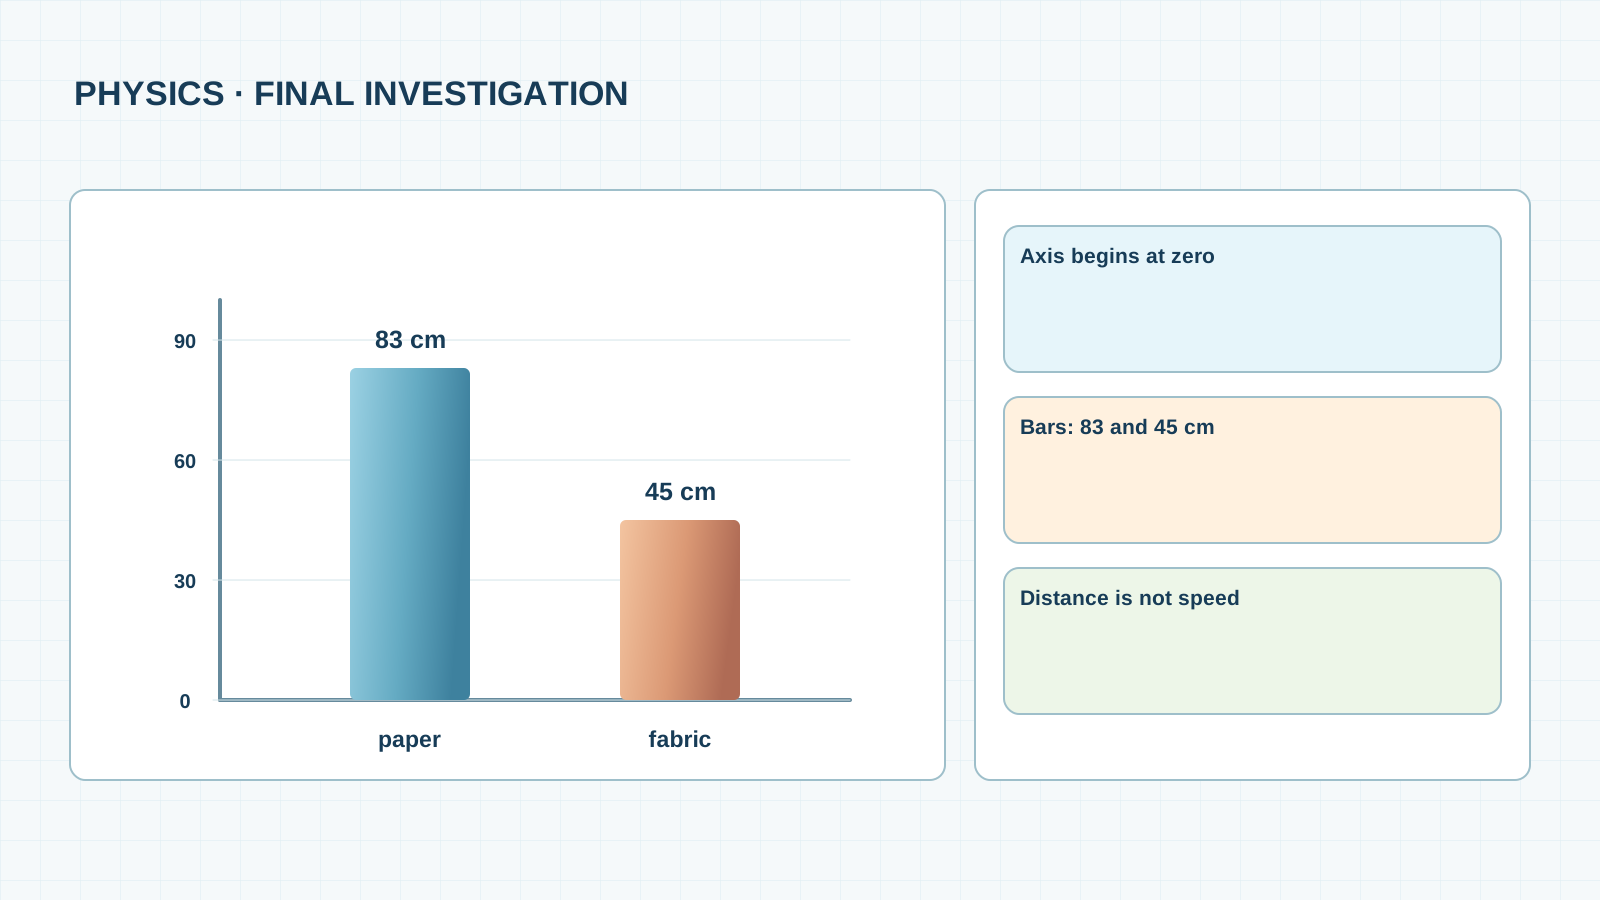
If bars of 83 and 45 cm begin at 40 cm, the first appears many times taller. The numbers are unchanged, but the picture misleads. A chart is for comparison, not decoration. Are paper and fabric numbers on a continuous scale or names of two groups?
New words without gaps
A category is a group name such as “paper”. Separate bars suit categories. The measured quantity is distance to rest in centimetres; a scale shows its values. Bar lengths should be counted from zero. A model is a simplified view of one aspect of reality. This chart shows mean distance, not the cart’s speed at every instant. Joining categories with a line does not reveal measured intermediate surfaces.
Work through supplied data
Draw an axis “distance to rest, cm” from 0 to 90. Bars: paper 83, fabric 45 cm. The 38 cm difference is a calculation, not a third trial. Thin marks may show observed ranges 82–84 and 44–46 cm; do not call these a proven confidence interval.
Test safely
On squared paper let one large square mean 10 cm. Label the axis, unit, both coverings and title. Show the chart to someone who has not read the lesson: can they recover the values? A two-row text table is an accessible alternative that does not depend on colour.
A common mistake
Mistake: joining the surface names with a line as though a continuous transition was measured. Transfer: a third covering is added. What changes in the chart? Why is the 83 cm bar not a speed?
Support diagram
Check your understanding
Close the text and explain the left-to-right drawing to a new learner. Name an observation, a teaching assumption and something the evidence does not prove. Then answer the transfer question without a hint and check units or direction against the diagram. If you disagree, return to the first unfamiliar word rather than memorising a sentence. A spoken explanation, a drawing and a measurement are different kinds of evidence: label each honestly.
Lab notebook page
Add a line to My World Lab Notebook: question → prediction → controlled conditions → changed condition → observation or calculation → conclusion → limit. Put a scale on a drawing or mark it ‘schematic’. If you ran no experiment, write ‘supplied calculation’, not ‘we measured’. Revisit the entry after the next lesson and note what became clearer.
Next lesson: What do the numbers prove, and what does a source prove?
If you have found a mistake or a typo in this article, tell us about it
Comments (0)
Log in to leave a comment →
No comments yet. Be the first.